Fig. 1.
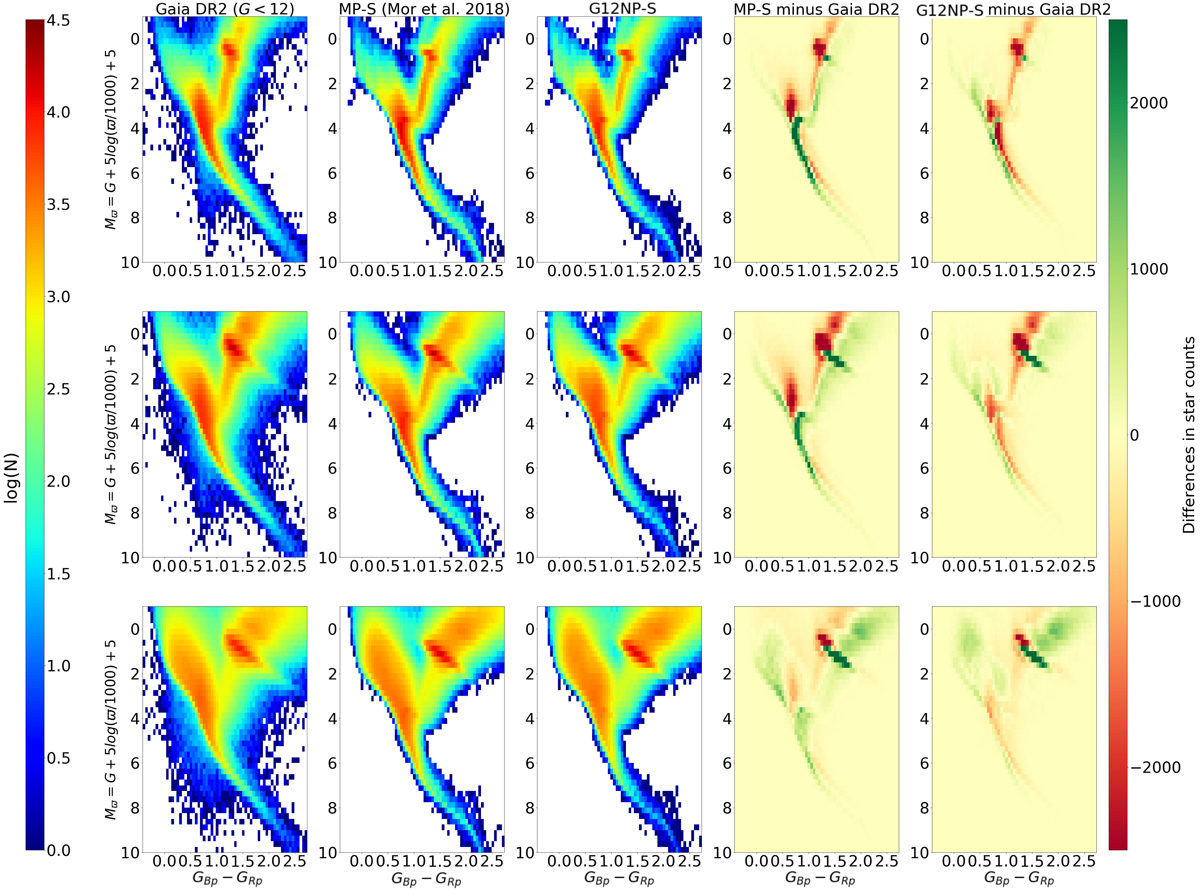
Mϖ vs. Gaia colour GBp − GRp for the stars with G < 12 divided into three latitude ranges: first row: 30 < |b|< 90; second row: 10 < |b|< 30; third row: |b|< 10. The colour-map of the first, second, and third columns shows the logarithm of the star counts in each bin. The first column is Gaia DR2 data and the second column is the most probable model variant from Mor et al. (2018), which has an exponential SFH and whose IMF has α3 ≈ 3. The third column is for the best-fit model using a non-parametric SFH, whose IMF has α3 ≈ 2 (this work). The BGM simulations performed for this figure use the Stilism extinction map. In the fourth column we show, for each bin, the difference of star counts MP-S minus Gaia DR2 data. In the fifth column we show, for each bin, the difference of star counts G12NP-S minus Gaia DR2 data. Observational data and simulations are limited here at G < 12 and 10 < Mϖ < −1.
Current usage metrics show cumulative count of Article Views (full-text article views including HTML views, PDF and ePub downloads, according to the available data) and Abstracts Views on Vision4Press platform.
Data correspond to usage on the plateform after 2015. The current usage metrics is available 48-96 hours after online publication and is updated daily on week days.
Initial download of the metrics may take a while.