Fig. 2.
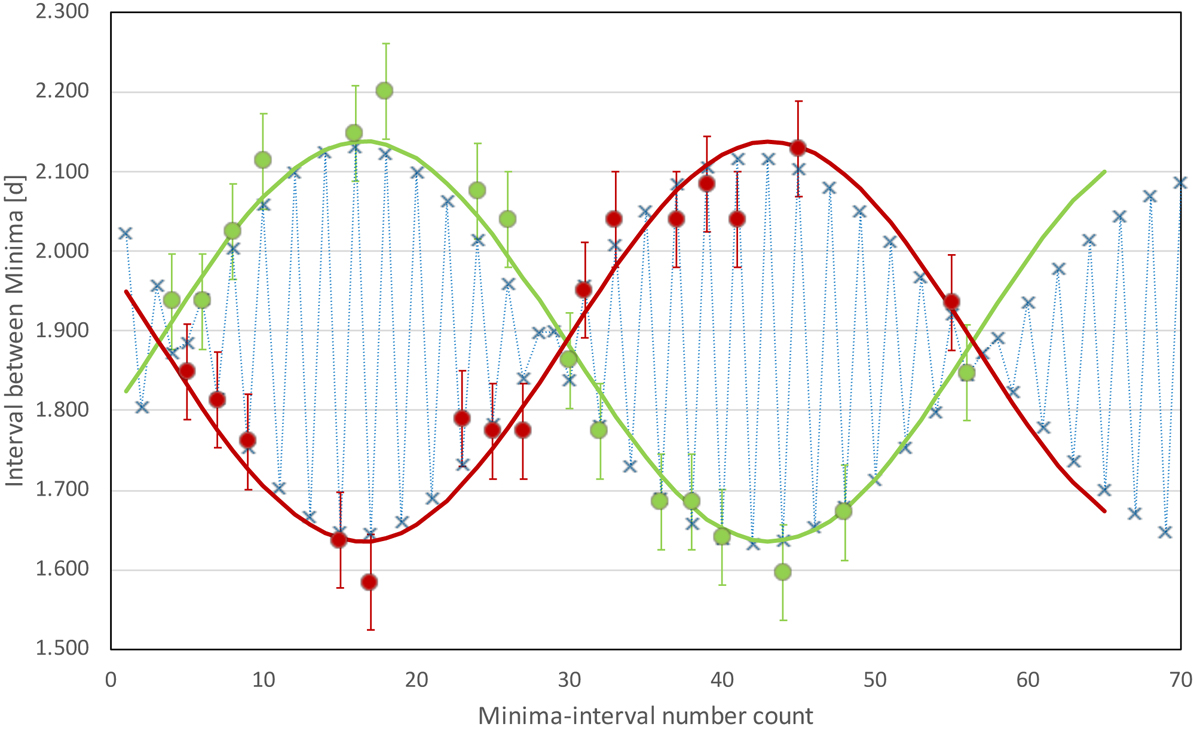
Measured intervals between consecutive minima. The red dots mark the differences in even number minus odd number minima, and green dots show the differences in odd minus even minima. The green and red lines are sine curve fits to the measurements. The blue crosses connected by the blue dotted line show the calculated intervals from the final orbital solution (see text).
Current usage metrics show cumulative count of Article Views (full-text article views including HTML views, PDF and ePub downloads, according to the available data) and Abstracts Views on Vision4Press platform.
Data correspond to usage on the plateform after 2015. The current usage metrics is available 48-96 hours after online publication and is updated daily on week days.
Initial download of the metrics may take a while.