Fig. 1.
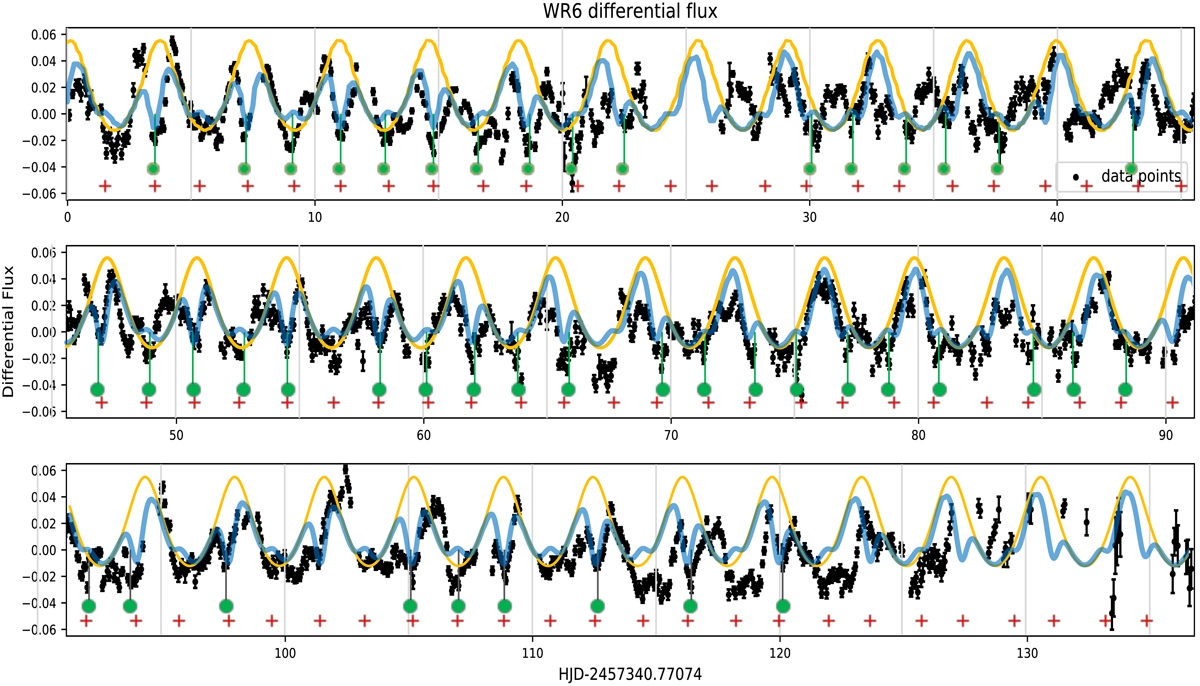
Copy of Fig. 1 published by Moffat et al. (2018), displaying the photometric light curve of EZ CMa as observed by the Toronto BRITE satellite from 2015 November 14 until 2016 March 29. The measured times of well-defined minima are indicated by green dots. The calculated times of upper and lower panels conjunctions of the orbit, with the parameters given in Table 2 that are described in the text, are marked by plus signs. The uneclipsed photometric light curve from a shocked zone, which is assumed to vary proportionally to the square of the orbital separation, is given by the orange curve. The light from the shock zone is eclipsed twice each orbit, and the light curve resulting from a simple Gauss-shaped eclipse model is shown by the blue line.
Current usage metrics show cumulative count of Article Views (full-text article views including HTML views, PDF and ePub downloads, according to the available data) and Abstracts Views on Vision4Press platform.
Data correspond to usage on the plateform after 2015. The current usage metrics is available 48-96 hours after online publication and is updated daily on week days.
Initial download of the metrics may take a while.