Fig. 5
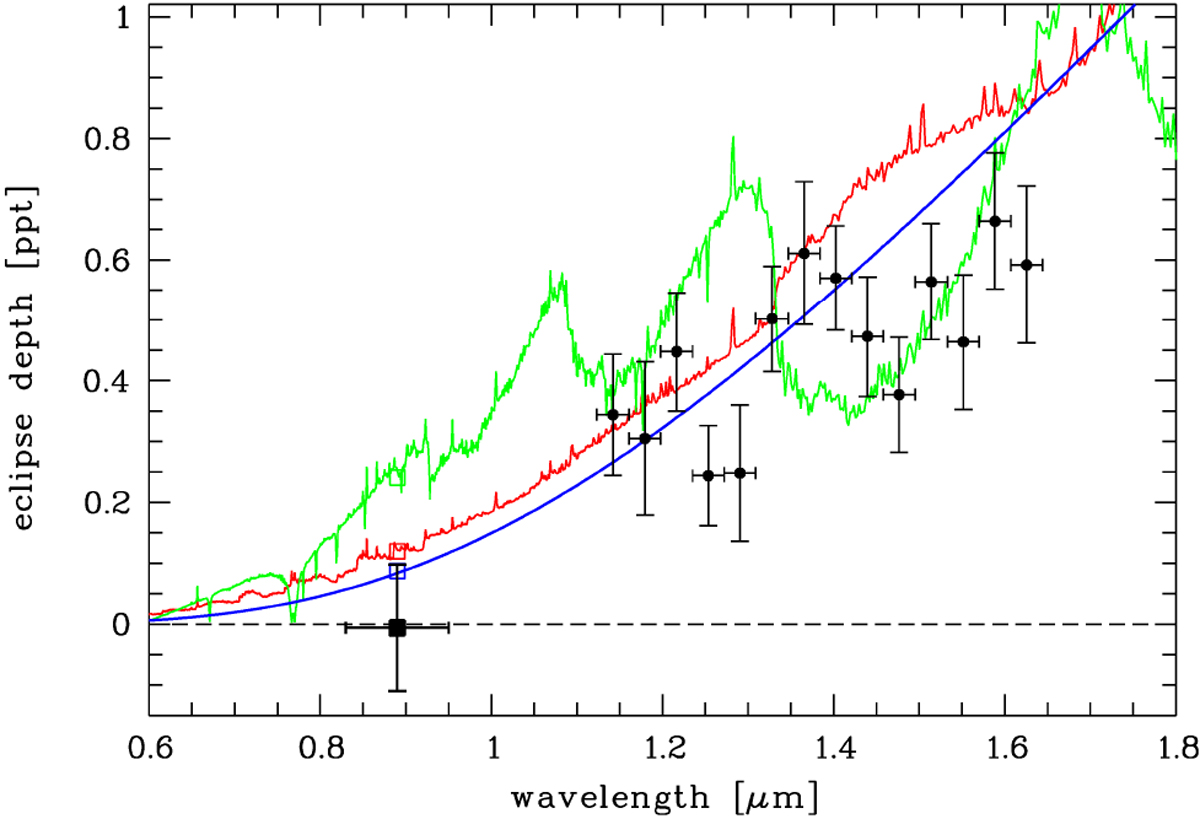
Emission spectrum of HAT-P-32 b. The z′ band measurement of this work is shown as square symbol; the data points of Nikolov et al. (2018) are shown as circles. The horizontal lines denote the wavelength interval of each data point. Overplotted in red is an ATMO forward model with an inverted atmospheric P–T profile including TiO/VO absorption, in green a model with a non-inverted atmosphere without TiO/VO (both reproduced from Nikolov et al. 2018), and in blue a blackbody spectrum for star and planet with a planetary temperature of 1995 K. The model values binned to the z′ band wavelength interval are shown with open squares.
Current usage metrics show cumulative count of Article Views (full-text article views including HTML views, PDF and ePub downloads, according to the available data) and Abstracts Views on Vision4Press platform.
Data correspond to usage on the plateform after 2015. The current usage metrics is available 48-96 hours after online publication and is updated daily on week days.
Initial download of the metrics may take a while.