Fig. 3
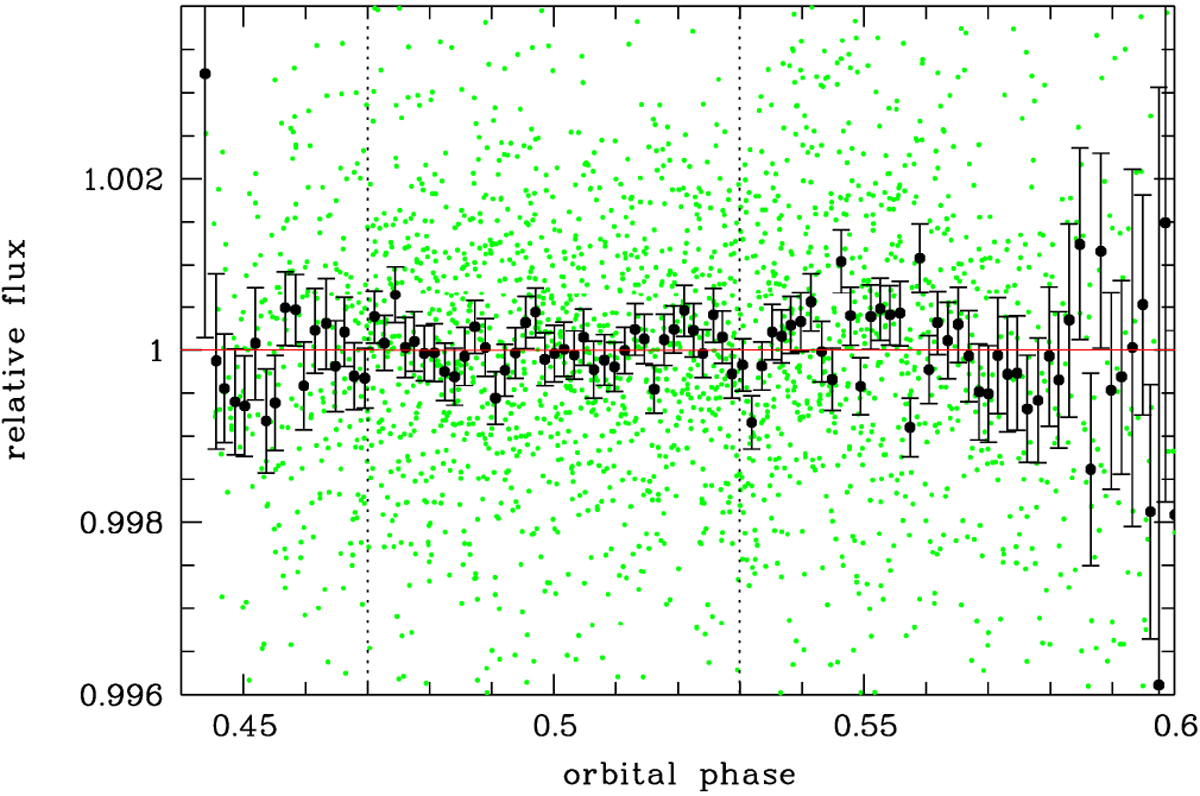
Secondary eclipse light curve after orbital phase folding. The black data points indicate the values binned in 5 min intervals of the orbital phase. The green data points show the unbinned values of the 11 individual light curves after detrending. The best-fit model of the joint fit is given in red. The dotted vertical lines denote beginning and end of the eclipse event.
Current usage metrics show cumulative count of Article Views (full-text article views including HTML views, PDF and ePub downloads, according to the available data) and Abstracts Views on Vision4Press platform.
Data correspond to usage on the plateform after 2015. The current usage metrics is available 48-96 hours after online publication and is updated daily on week days.
Initial download of the metrics may take a while.