Open Access
Fig. 4
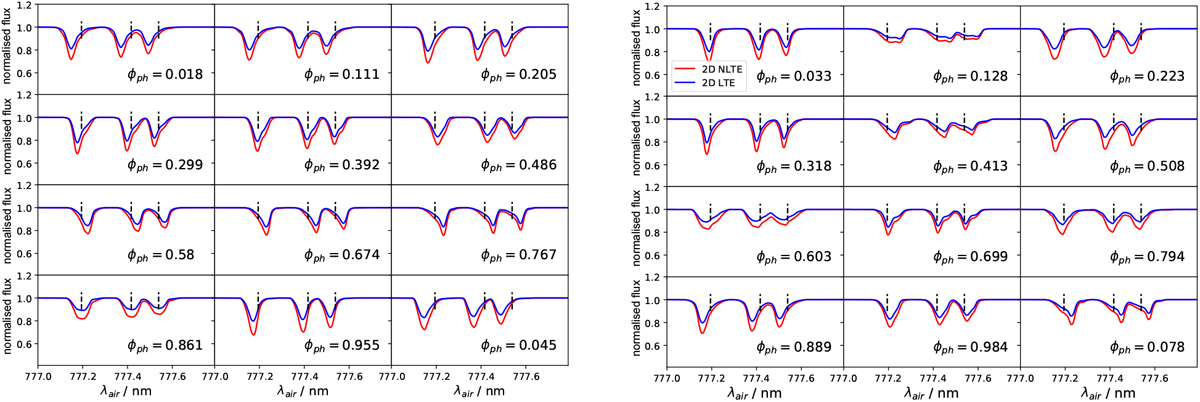
Variation in the O I 777 nm triplet during a particular pulsational cycle for LTE (blue) and non-LTE (red) cases calculated for the three-day M3 Cepheid model (left panel) and for the nine-day M9 Cepheid model (right panel). The dashed vertical lines indicate the lines’ rest wavelengths.
Current usage metrics show cumulative count of Article Views (full-text article views including HTML views, PDF and ePub downloads, according to the available data) and Abstracts Views on Vision4Press platform.
Data correspond to usage on the plateform after 2015. The current usage metrics is available 48-96 hours after online publication and is updated daily on week days.
Initial download of the metrics may take a while.