Open Access
Fig. 2
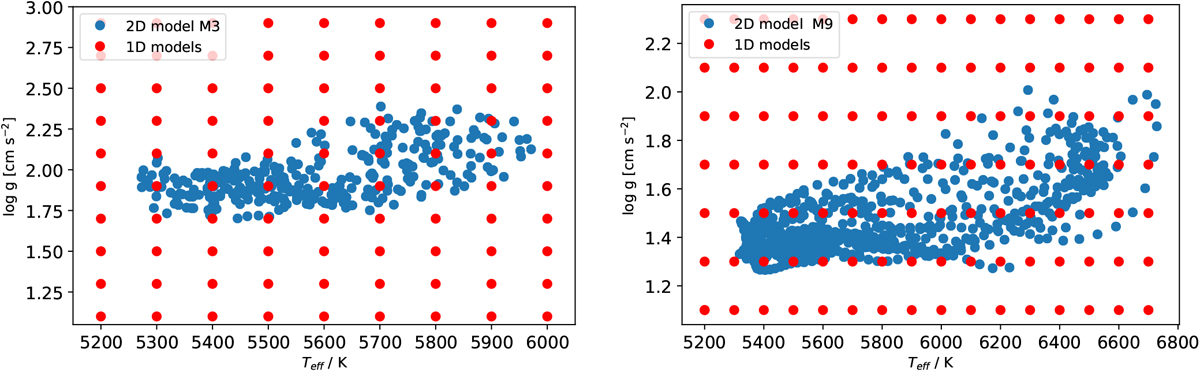
Grid of 1D hydrostatic models (red dots) in the log g–Teff plane. The 2D snapshots defined individually by log geff and Teff for model M3 (left panel) and M9 (right panel) are indicated by blue dots.
Current usage metrics show cumulative count of Article Views (full-text article views including HTML views, PDF and ePub downloads, according to the available data) and Abstracts Views on Vision4Press platform.
Data correspond to usage on the plateform after 2015. The current usage metrics is available 48-96 hours after online publication and is updated daily on week days.
Initial download of the metrics may take a while.