Fig. 7.
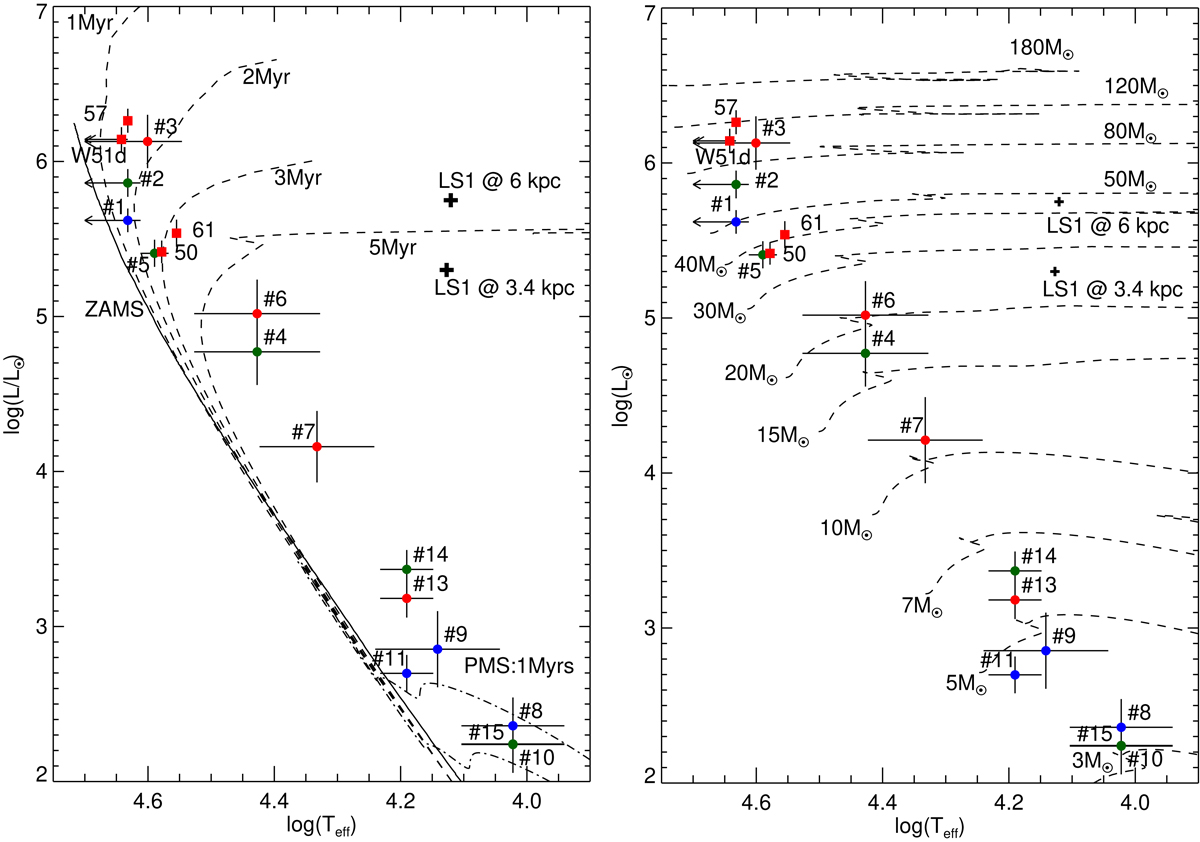
HRD of stars identified as OB stars in our spectroscopic survey. The coloured sources are the locations with the extinction correction of Nishiyama et al. (2009). The colour coding of the sources indicates in which region they are located: red: field II, green: field III and blue: field IV. The location of LS1 (Okumura et al. 2000) for the assumed distances of 3.4 and 6 kpc is marked with a “plus” sign. The red squares are the massive stars classified by Figuerêdo et al. (2008) and Barbosa et al. (2008). Left panel: solid line represents the ZAMS isochrone from Lejeune & Schaerer (2001) and the dashed lines the main-sequence isochrones for 1, 2, 3 and 5 Myr from Ekström et al. (2012) and Yusof et al. (2013). The dash-dot lines represent the PMS isochrones of 1 and 2 Myr from Tognelli et al. (2011). Right panel: dashed lines represent the evolutionary tracks from Ekström et al. (2012) and Yusof et al. (2013).
Current usage metrics show cumulative count of Article Views (full-text article views including HTML views, PDF and ePub downloads, according to the available data) and Abstracts Views on Vision4Press platform.
Data correspond to usage on the plateform after 2015. The current usage metrics is available 48-96 hours after online publication and is updated daily on week days.
Initial download of the metrics may take a while.