Fig. 1.
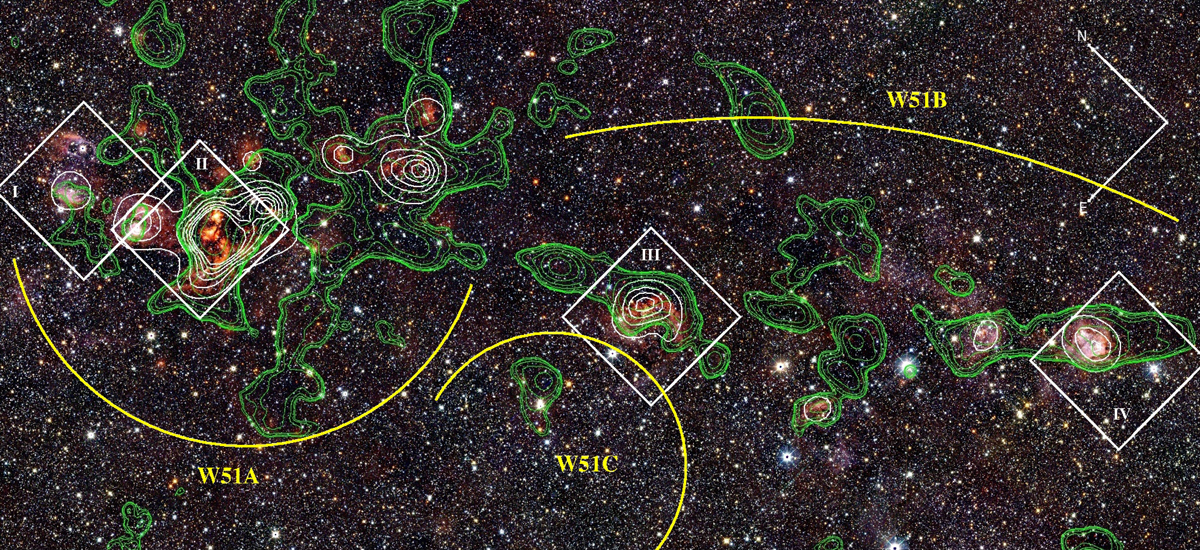
Three-colour JHKs-band image from 2MASS of W51 (20′ × 40′), overlaid by 1.1 mm dust continuum contour from the Bolocam survey (Aguirre et al. 2011) in green and the 1.4 GHz NRAO VLA Sky Survey (NVSS, Condon et al. 1998) contours in white. The four white boxes mark the areas where photometry and spectroscopy are obtained. From left to right: field I and II cover HII region G49.5–0.4, field III G49.2–0.3 and field IV covers G48.9–0.3. The yellow arcs mark the location and extent of the 3 subregions in W51: W51A, W51B and W51C used throughout the paper.
Current usage metrics show cumulative count of Article Views (full-text article views including HTML views, PDF and ePub downloads, according to the available data) and Abstracts Views on Vision4Press platform.
Data correspond to usage on the plateform after 2015. The current usage metrics is available 48-96 hours after online publication and is updated daily on week days.
Initial download of the metrics may take a while.