Free Access
Fig. 8.
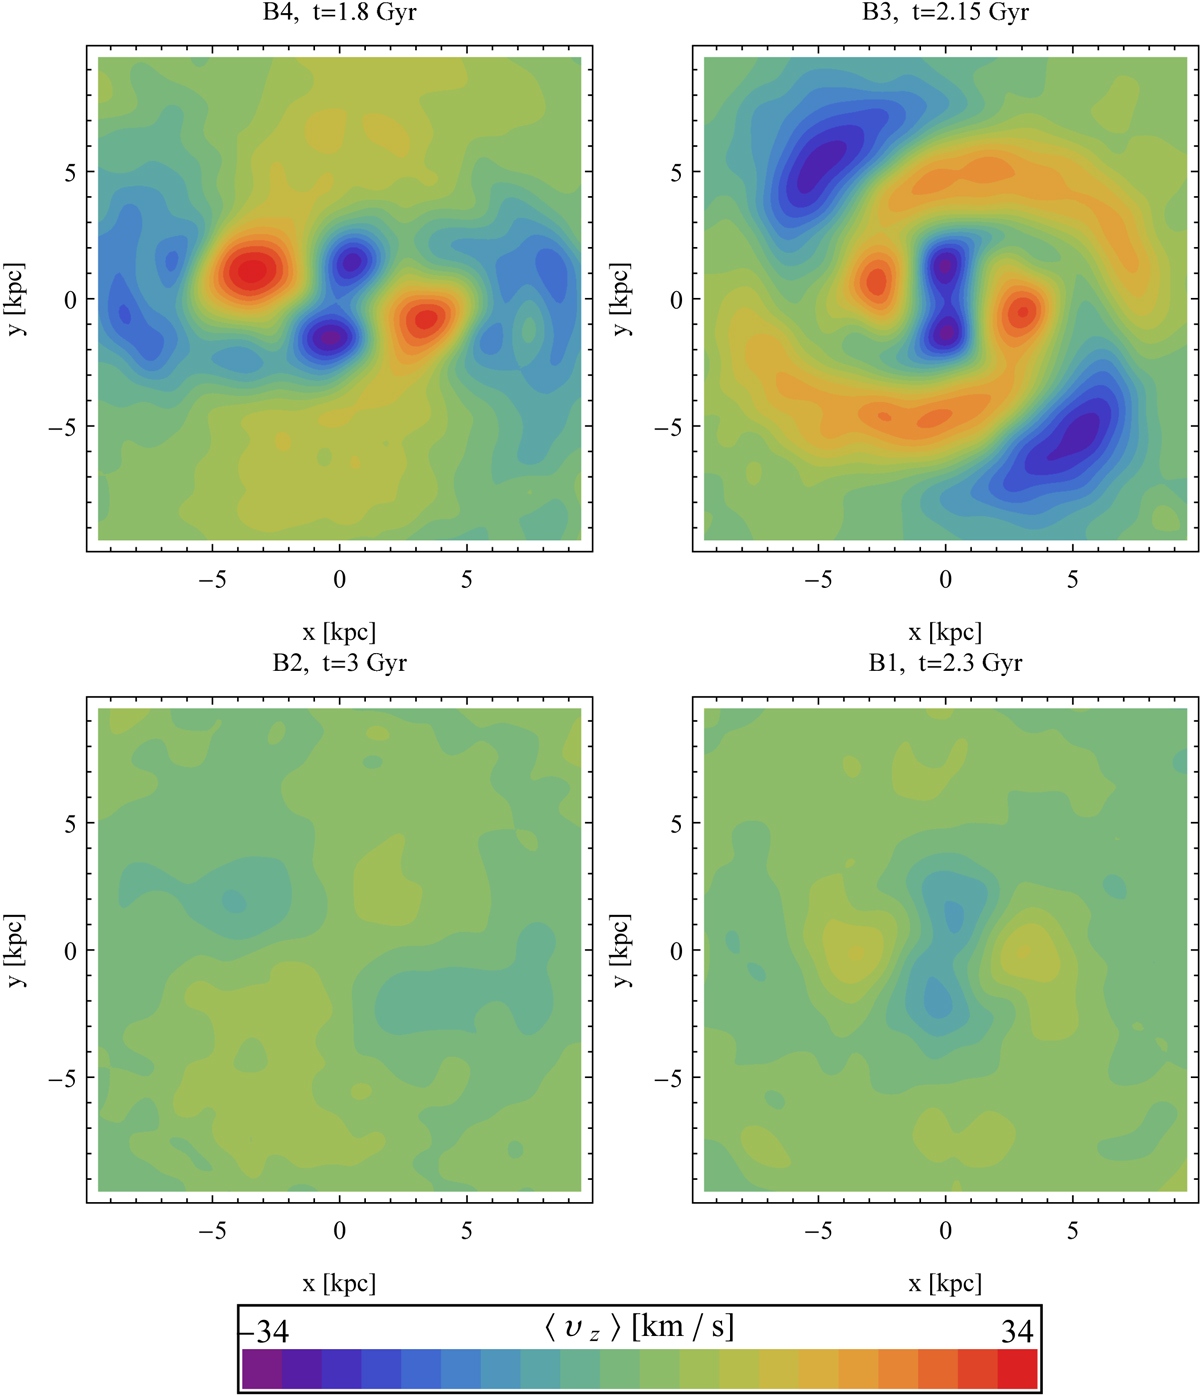
Face-on maps of the mean velocity of the stars along the vertical axis, ⟨υz⟩, for simulations B4–B1 at the time of strongest buckling, except for B2 where the final output of the simulation (t = 3 Gyr) is shown. Positive velocities point along the disk’s angular momentum vector.
Current usage metrics show cumulative count of Article Views (full-text article views including HTML views, PDF and ePub downloads, according to the available data) and Abstracts Views on Vision4Press platform.
Data correspond to usage on the plateform after 2015. The current usage metrics is available 48-96 hours after online publication and is updated daily on week days.
Initial download of the metrics may take a while.