Fig. 1
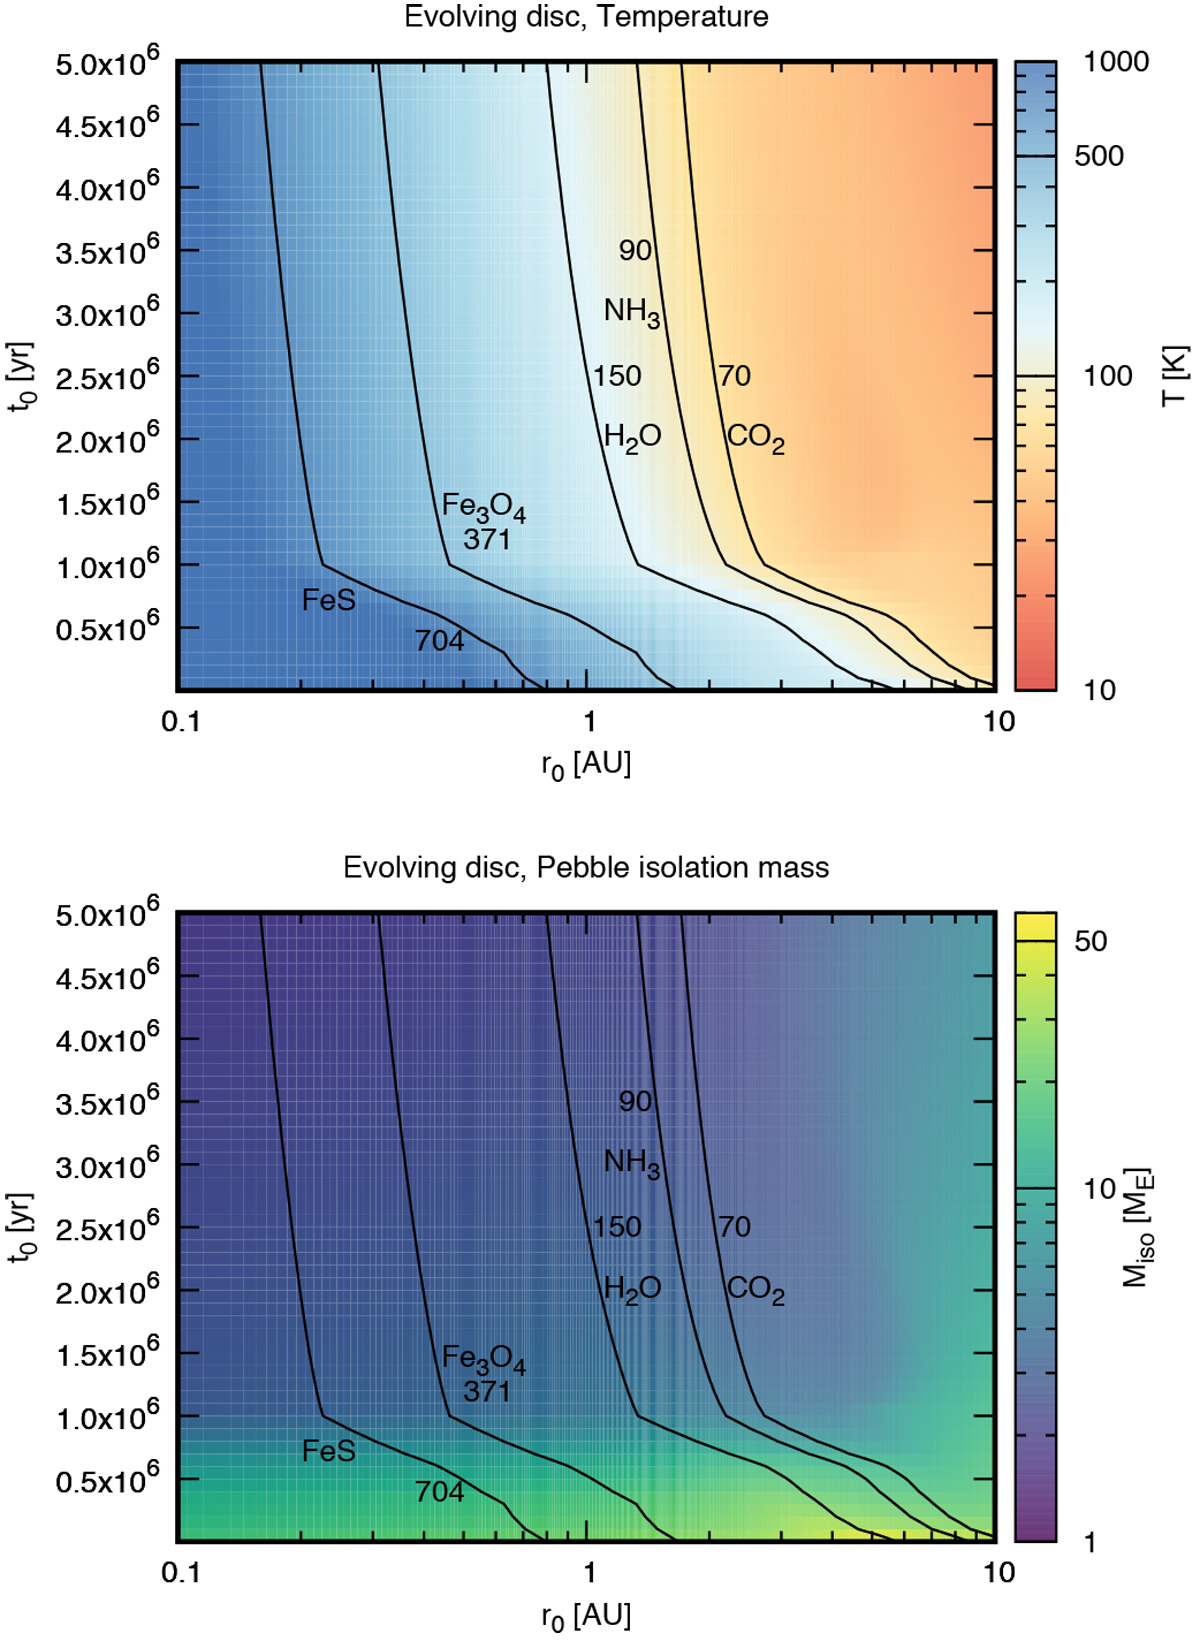
Temperature as a function of initial orbital distance r0 and initial time t0 (top) and the pebble isolation mass as a function of initial orbital distance r0 and time t0 (bottom) for the Bitsch et al. (2015a) disc model. The black lines indicate the ice lines of FeS, Fe3 O4, H2 O, NH3 and CO2, where the numbers mark their condensation temperatures, see Table 1. The temperature initially decreases very fast due to the decrease of viscous heating. This inturn reduces the pebble isolation mass in the inner disc. As the outer disc (r > 6 AU) is dominated by stellar irradiation, the aspect ratio and thus the pebble isolation mass remain large.
Current usage metrics show cumulative count of Article Views (full-text article views including HTML views, PDF and ePub downloads, according to the available data) and Abstracts Views on Vision4Press platform.
Data correspond to usage on the plateform after 2015. The current usage metrics is available 48-96 hours after online publication and is updated daily on week days.
Initial download of the metrics may take a while.