Free Access
Fig. 7.
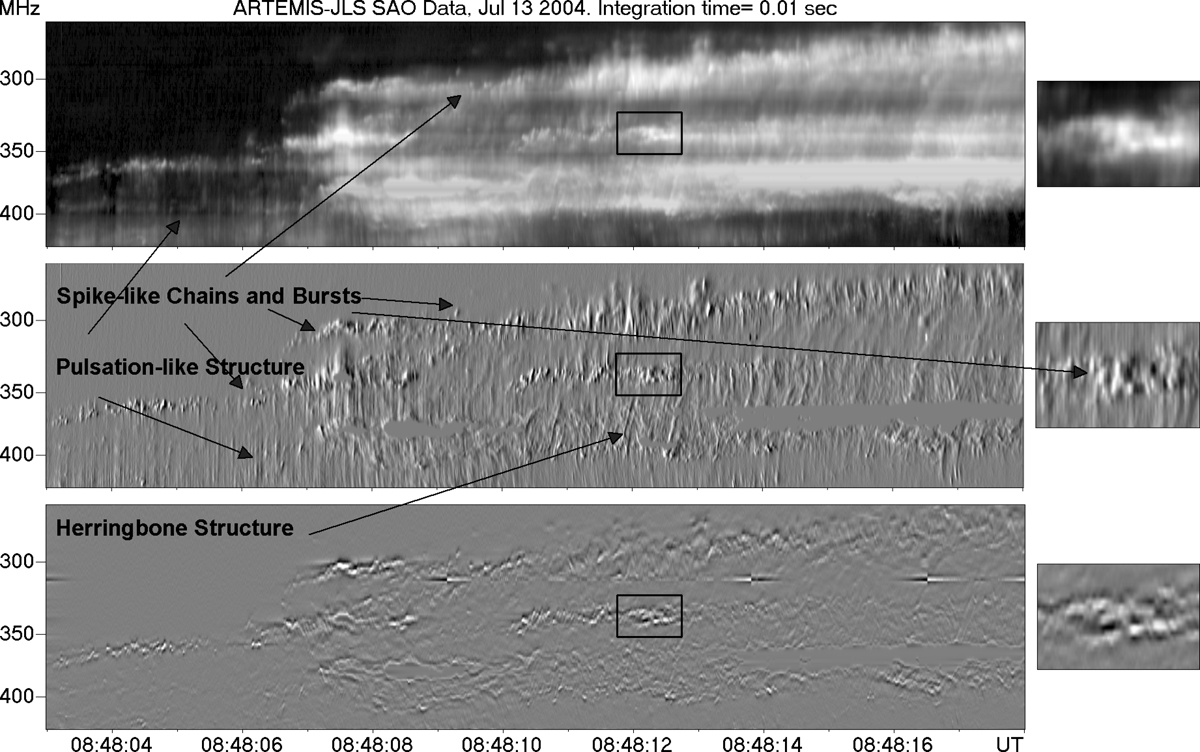
Same as Fig. 5 for the third event. The uniform gray patches in the middle of the differential spectrum are due to saturation effects. Artifacts near 312 MHz in the filtered spectrum are due to interference signals.
Current usage metrics show cumulative count of Article Views (full-text article views including HTML views, PDF and ePub downloads, according to the available data) and Abstracts Views on Vision4Press platform.
Data correspond to usage on the plateform after 2015. The current usage metrics is available 48-96 hours after online publication and is updated daily on week days.
Initial download of the metrics may take a while.