Fig. 5.
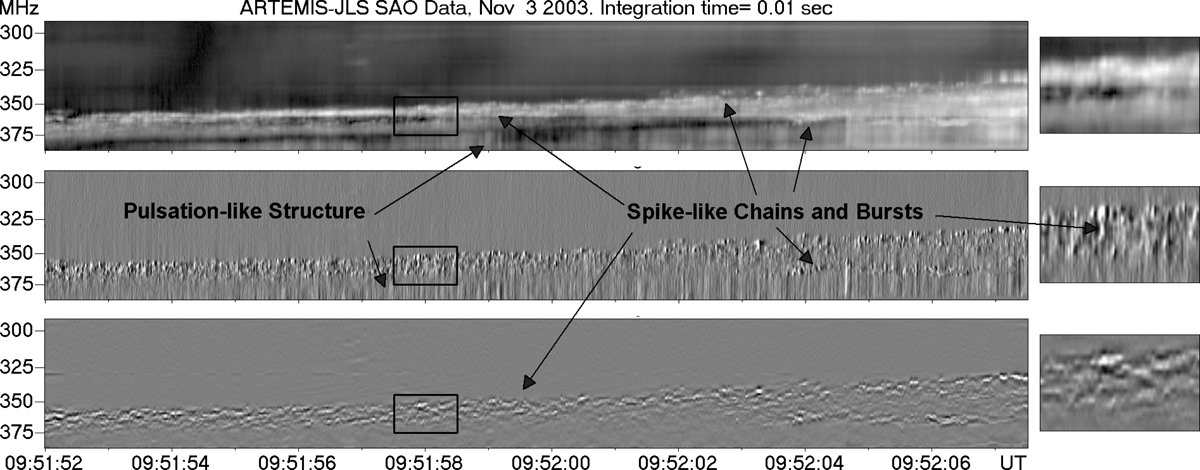
Part of the high time resolution dynamic spectrum for the first event. Top panel: original spectrum, middle panel: derivative with respect to time (differential spectrum), and lower panel: spectrum after high pass filtering in time and frequency. The boxes indicate a 1 s by 30 MHz segment of the spectrum that is shown enlarged on the right. The arrows point at type II associated fine structures.
Current usage metrics show cumulative count of Article Views (full-text article views including HTML views, PDF and ePub downloads, according to the available data) and Abstracts Views on Vision4Press platform.
Data correspond to usage on the plateform after 2015. The current usage metrics is available 48-96 hours after online publication and is updated daily on week days.
Initial download of the metrics may take a while.