Fig. 6.
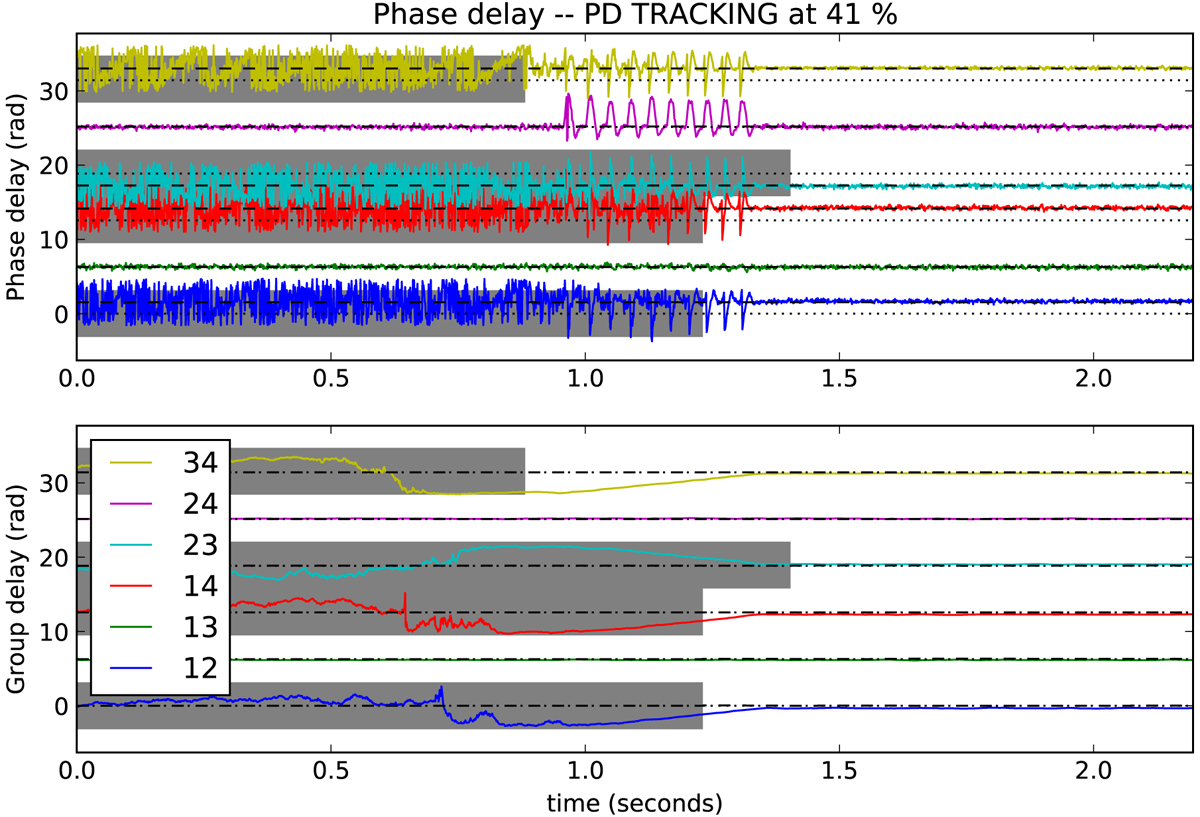
Phase Φi, j (upper panel) and group Ψi, j (lower panel) delays. All values are phases modulo 2π. The dashed lines correspond to the piezo command. From bottom to top, the phases correspond to baselines i, j equal to 12, 13, 14, 23, 24, and 34. At the beginning of this recording, the system only has fringes on two baselines (green and purple). At t = 0.8 s, the system found fringes on the yellow baseline, and later on all the other baselines. Gray areas correspond to the baselines whose S/N is below the value ![]() , meaning that no tracking is performed. After t = 1.4 s, the system nominally tracks on all baselines.
, meaning that no tracking is performed. After t = 1.4 s, the system nominally tracks on all baselines.
Current usage metrics show cumulative count of Article Views (full-text article views including HTML views, PDF and ePub downloads, according to the available data) and Abstracts Views on Vision4Press platform.
Data correspond to usage on the plateform after 2015. The current usage metrics is available 48-96 hours after online publication and is updated daily on week days.
Initial download of the metrics may take a while.