Fig. 11.
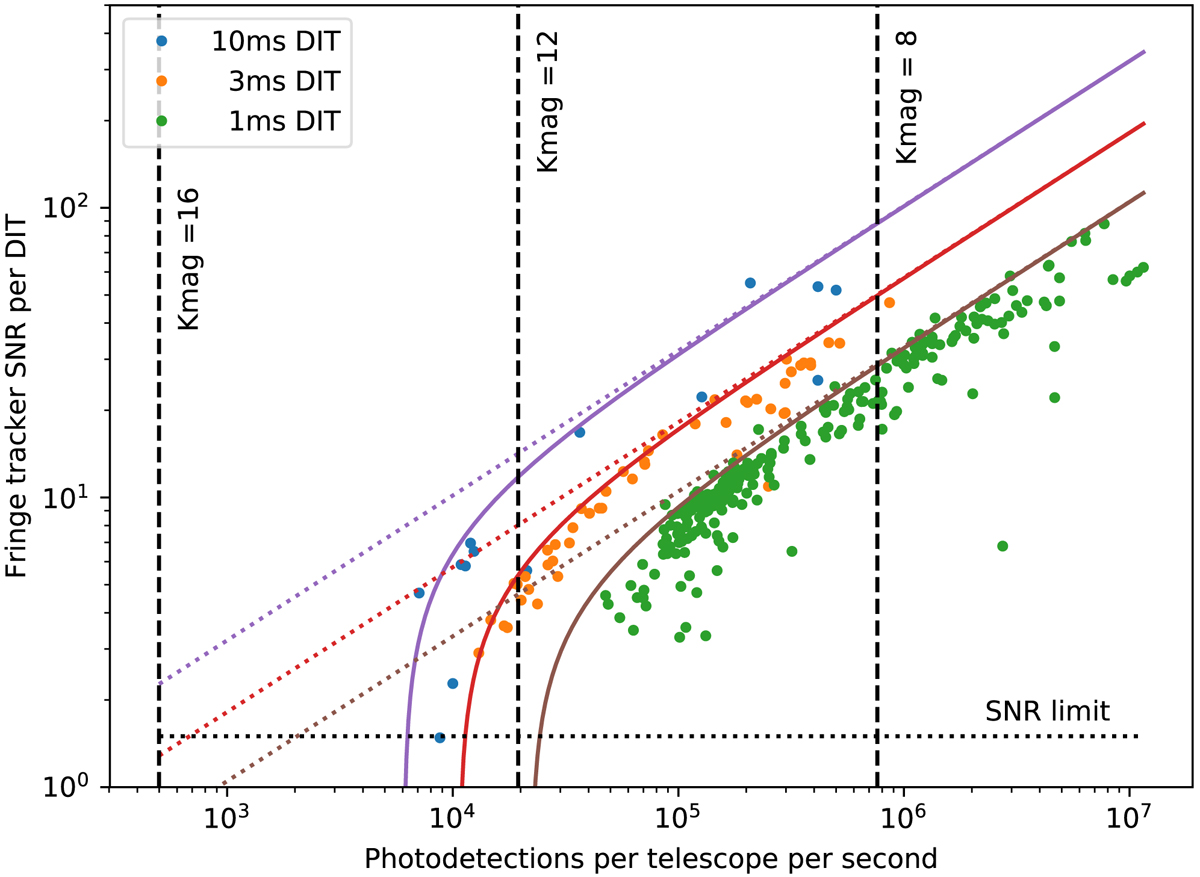
Signal-to-noise ratio as a function of detected photon per telescope per DIT. The S/N is the computed by the real-time computer, defined by ![]() , as stated in Eq. (14). The three colors correspond to the three different frame rates of the fringe tracker. The solid lines correspond to theoretical values assuming 100% fringe contrast. The vertical lines are theoretical flux assuming observations on UTs with 1% throughput. The horizontal line corresponds to an S/N of 1.5.
, as stated in Eq. (14). The three colors correspond to the three different frame rates of the fringe tracker. The solid lines correspond to theoretical values assuming 100% fringe contrast. The vertical lines are theoretical flux assuming observations on UTs with 1% throughput. The horizontal line corresponds to an S/N of 1.5.
Current usage metrics show cumulative count of Article Views (full-text article views including HTML views, PDF and ePub downloads, according to the available data) and Abstracts Views on Vision4Press platform.
Data correspond to usage on the plateform after 2015. The current usage metrics is available 48-96 hours after online publication and is updated daily on week days.
Initial download of the metrics may take a while.