Fig. 7.
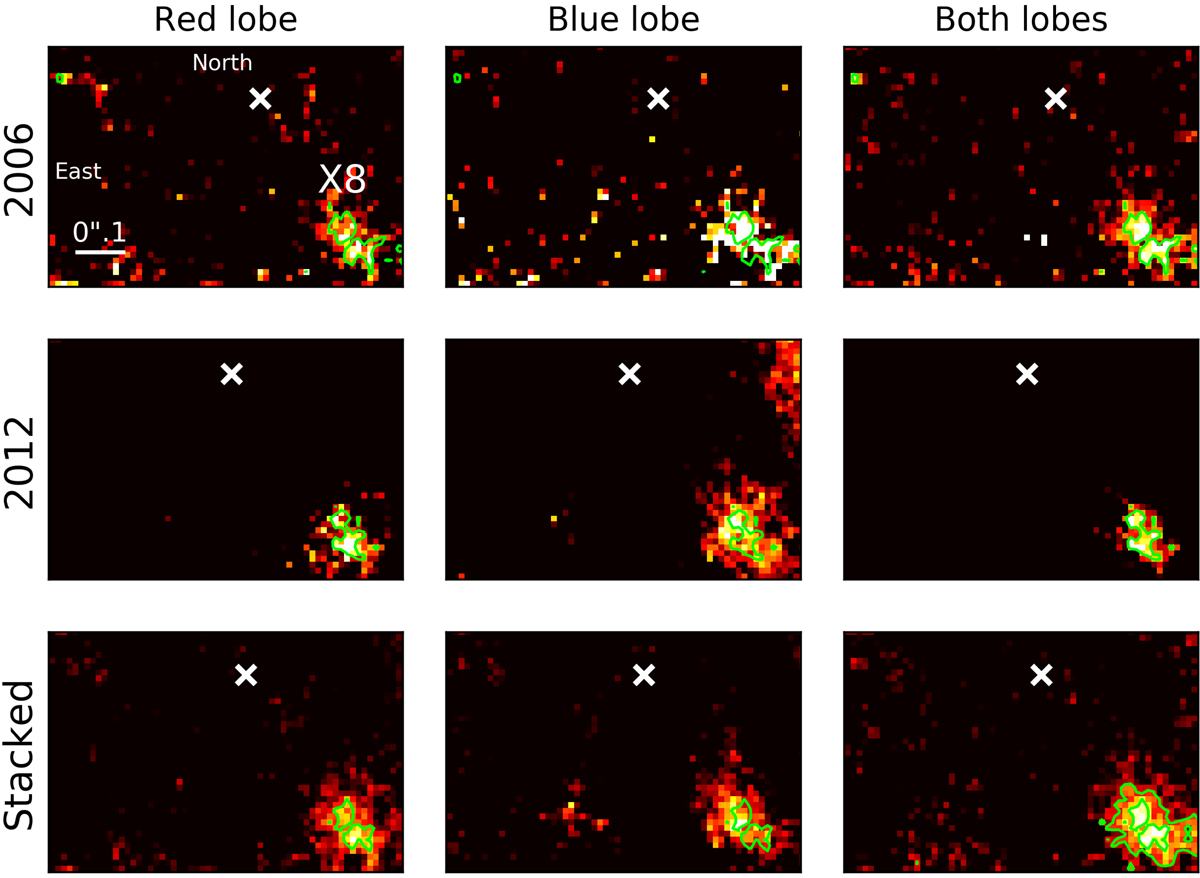
Blueshifted Brγ line maps of X8 in 2006 and 2012. A scale valid for all images is given in the top left panel. The last row shows the stacked result of 2006 and 2012 with an averaged position of Sgr A* (white cross) that is based on the years we present. The red lobe column represents the wavelength range of 2.16455 μm–2.16516 μm. The blue lobe results cover a wavelength range of 2.16394 μm–2.16455 μm. For the last column, we select the wavelength range of 2.16394 μm–2.16516 μm so that both lobes are visible.
Current usage metrics show cumulative count of Article Views (full-text article views including HTML views, PDF and ePub downloads, according to the available data) and Abstracts Views on Vision4Press platform.
Data correspond to usage on the plateform after 2015. The current usage metrics is available 48-96 hours after online publication and is updated daily on week days.
Initial download of the metrics may take a while.