Free Access
Fig. 6.
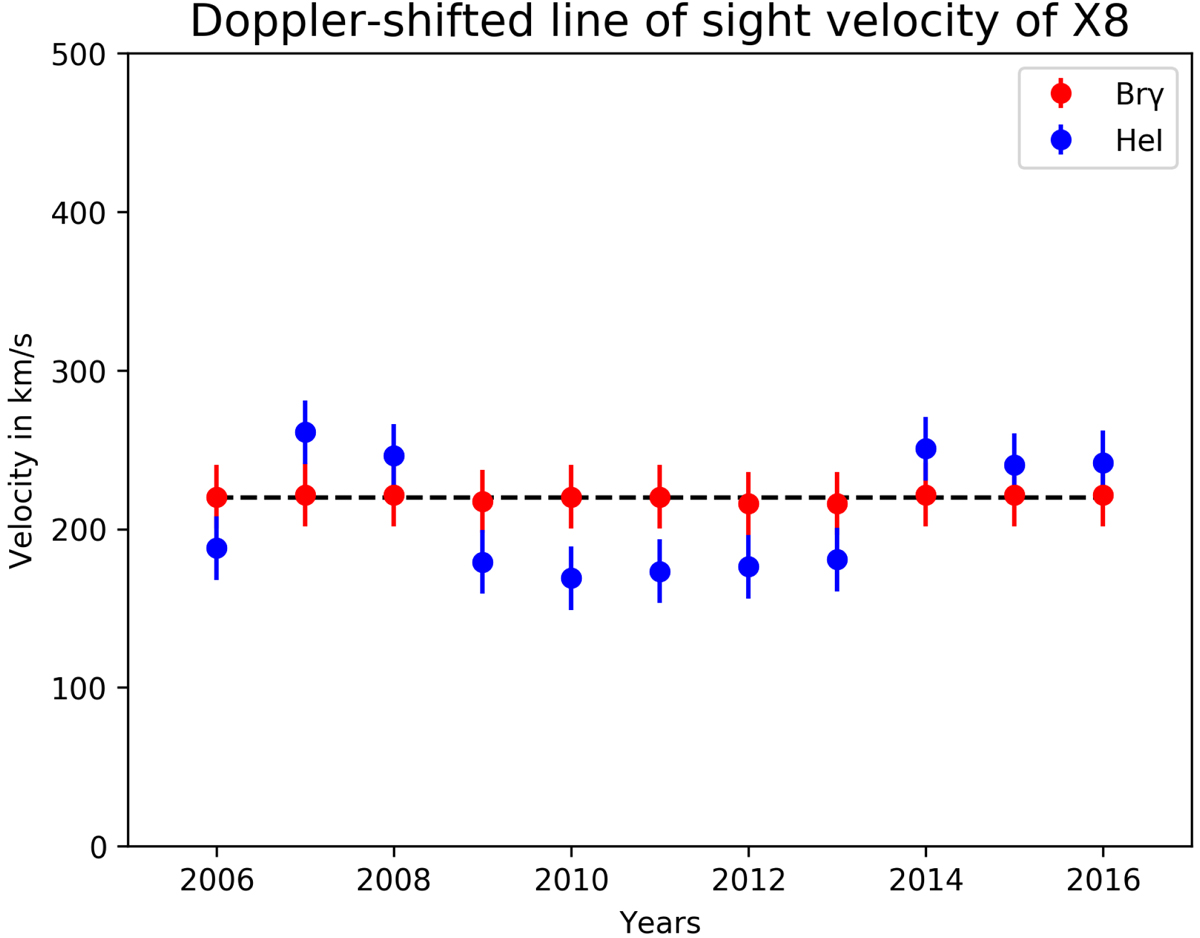
Line-of-sight of X8 between 2006 and 2016. It is based on the blueshifted centroid Brγ (red data points) and HeI (blue data points) velocity of X8 with an error of ±20 km s−1 for every data point. The dashed line represents a linear fit to the blueshifted Brγ data points.
Current usage metrics show cumulative count of Article Views (full-text article views including HTML views, PDF and ePub downloads, according to the available data) and Abstracts Views on Vision4Press platform.
Data correspond to usage on the plateform after 2015. The current usage metrics is available 48-96 hours after online publication and is updated daily on week days.
Initial download of the metrics may take a while.