Fig. 5.
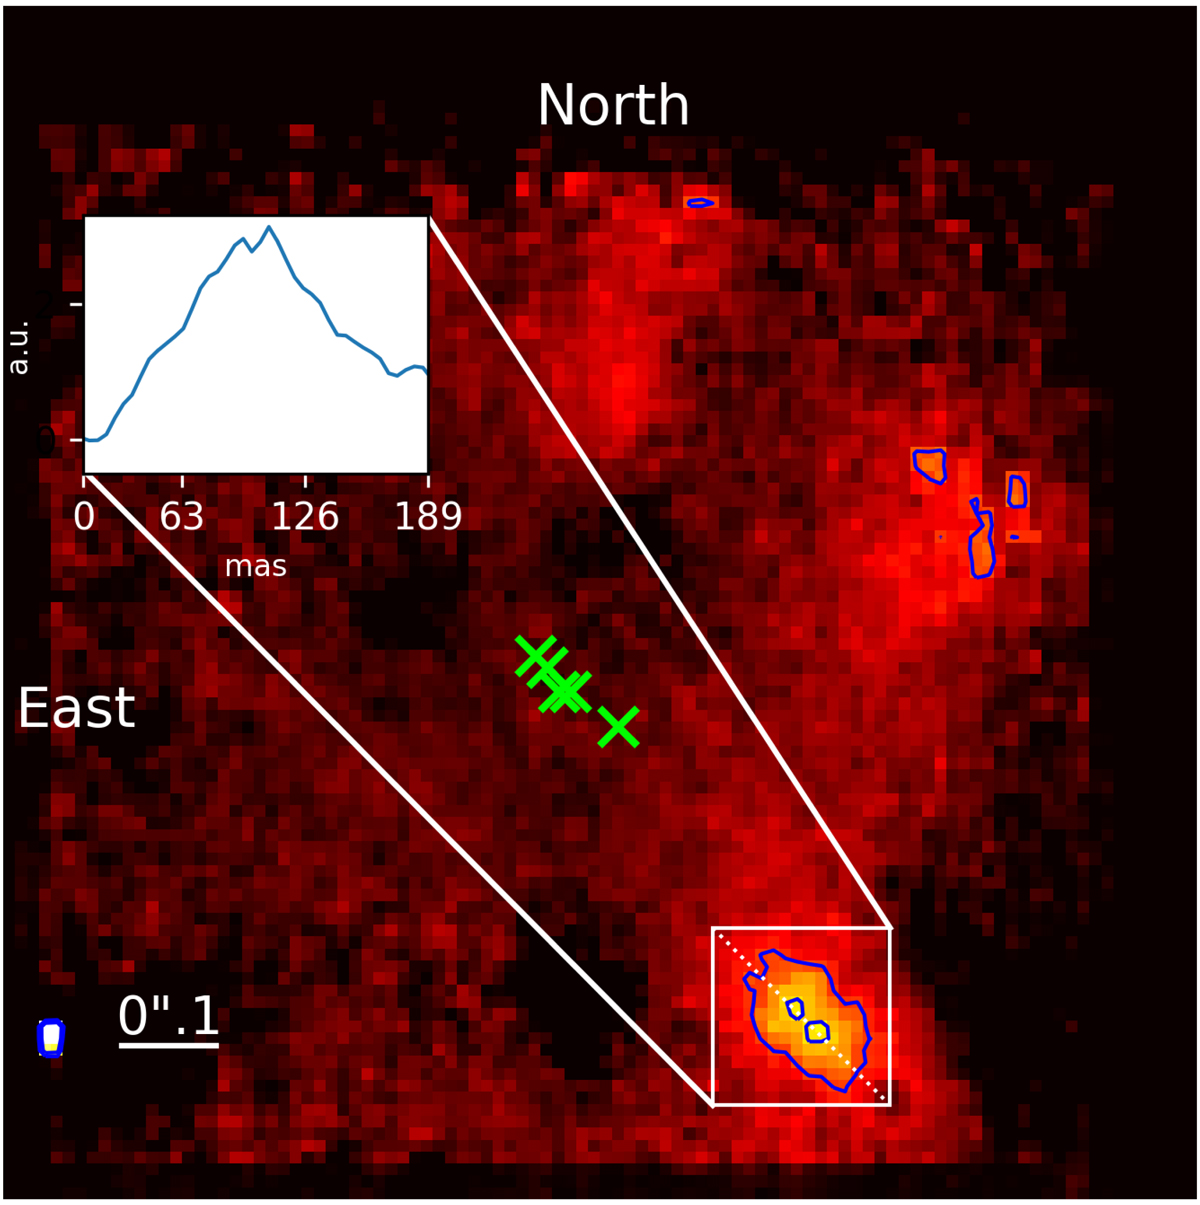
Stacked Brγ line map showing X8. The image is based on the 2006, 2012, 2013, 2015, and 2016 data sets. The data sets of 2008, 2009, 2010, 2011, and 2014 partially cover the X8 emission area or show effects from a reduced S/N. Because non-continuous effects can be found at the border of the data cube, the data sets of 2008, 2009, 2010, 2011, and 2014 were excluded from the stacking. The low S/N reflects that only a few exposures cover the X8 emission area or that the data-cube correction was unsatisfactory. Because the single Brγ line maps of 2006, 2012, 2013, 2015, and 2016 are centered on X8, the stacked figure implies an apparent movement of Sgr A*, which is indicated by a green cross. The y-axis of the white patch in the upper left corner is in arbitrary units (a.u.).
Current usage metrics show cumulative count of Article Views (full-text article views including HTML views, PDF and ePub downloads, according to the available data) and Abstracts Views on Vision4Press platform.
Data correspond to usage on the plateform after 2015. The current usage metrics is available 48-96 hours after online publication and is updated daily on week days.
Initial download of the metrics may take a while.