Fig. 4.
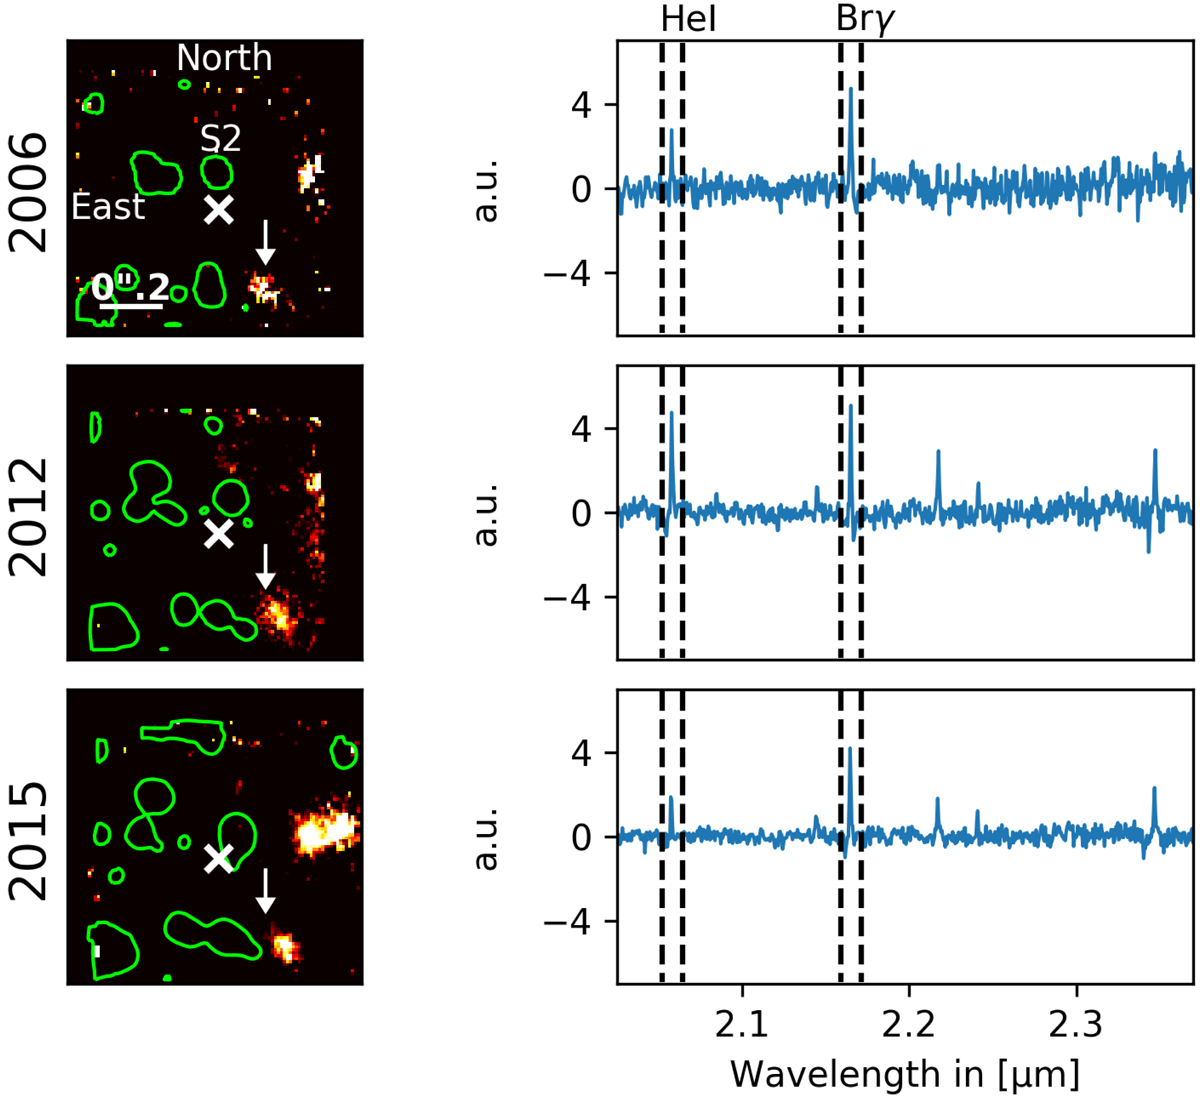
Blueshifted Brγ line maps of the GC at 2.164 μm (left) that are based on the data sets of 2006, 2012, and 2015. The green contour lines are extracted from the K-band continuum emission of the associated data cubes. Sgr A* is located at the cross, the S star S2 is labeled. The arrow points toward the position of X8 in the blueshifted Brγ line maps in 2006, 2012, and 2015. The cross is centered on SgrA* in every year. The arrow is fixed on the position of X8 in 2006 to show the proper motion. On the right side, the K-band spectrum between 2.0 μm–2.4 μm of X8 is presented. The intensity is given in arbitrary units (a.u.), and the blueshifted HeI and Brγ line are framed with a dashed line. The spectrum of 2012 and 2015 shows the blueshifted [Fe III] multiplet 3G − 3H at 2.1410 μm, 2.2142 μm, 2.2379 μm, and 2.3436 μm.
Current usage metrics show cumulative count of Article Views (full-text article views including HTML views, PDF and ePub downloads, according to the available data) and Abstracts Views on Vision4Press platform.
Data correspond to usage on the plateform after 2015. The current usage metrics is available 48-96 hours after online publication and is updated daily on week days.
Initial download of the metrics may take a while.