Fig. 3.
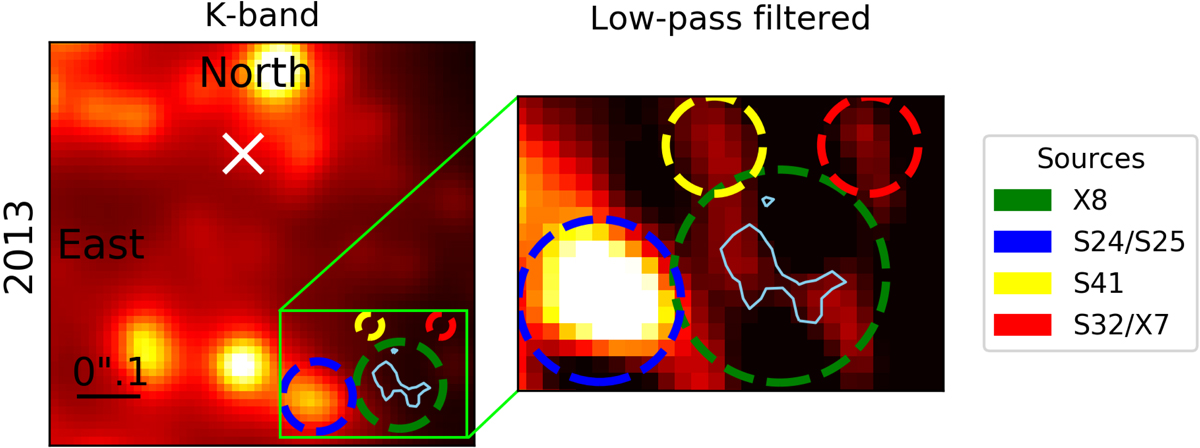
Galactic center in 2013. The on-source observation time is almost 30 h. Here we extracted a K-band image from the final data cube. On the right side, a zoomed-in and low-pass filtered image of the green rectangle area is presented. The green dashed circle shows the position of X8. The contour line is based on the blueshifted Brγ line map of 2013.
Current usage metrics show cumulative count of Article Views (full-text article views including HTML views, PDF and ePub downloads, according to the available data) and Abstracts Views on Vision4Press platform.
Data correspond to usage on the plateform after 2015. The current usage metrics is available 48-96 hours after online publication and is updated daily on week days.
Initial download of the metrics may take a while.