Fig. 2.
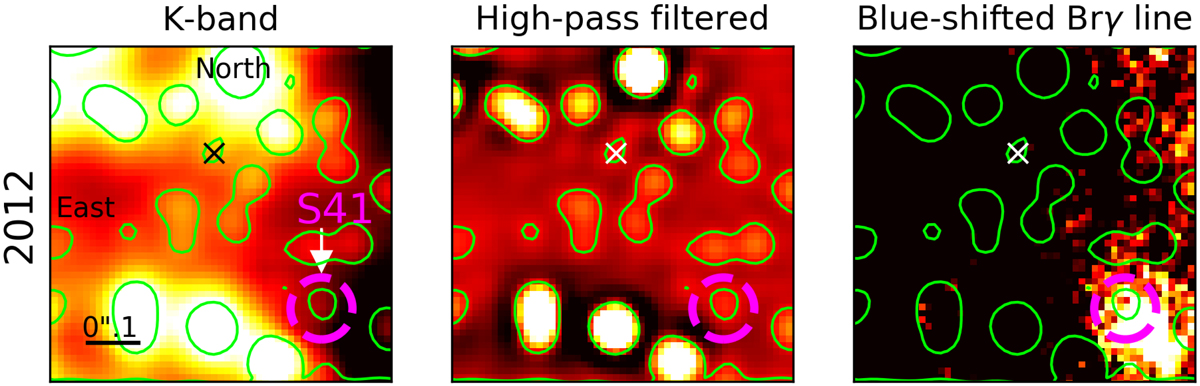
Galactic center in 2012 observed with SINFONI with a DIT of 600 s for each single data cube. In total, 61 data cubes are combined with an integrated exposure time of 610 min. The resulting on-source exposure time of the final data cube is around 10 h. North is up, east is to the left. The lime contour lines are based on the middle high-pass filtered image. It shows matching positions for the stars in the left K-band image. It is extracted from the SINFONI H+K data cube. The cross marks the position of Sgr A*. The magenta dashed circle indicates the position of S41. This S-star is in superposition with X8, which is displayed in the right image (bright white object in the lower right corner). This subplot is a blueshifted line map with respect to the Brγ rest wavelength at 2.1661 μm.
Current usage metrics show cumulative count of Article Views (full-text article views including HTML views, PDF and ePub downloads, according to the available data) and Abstracts Views on Vision4Press platform.
Data correspond to usage on the plateform after 2015. The current usage metrics is available 48-96 hours after online publication and is updated daily on week days.
Initial download of the metrics may take a while.