Fig. 1.
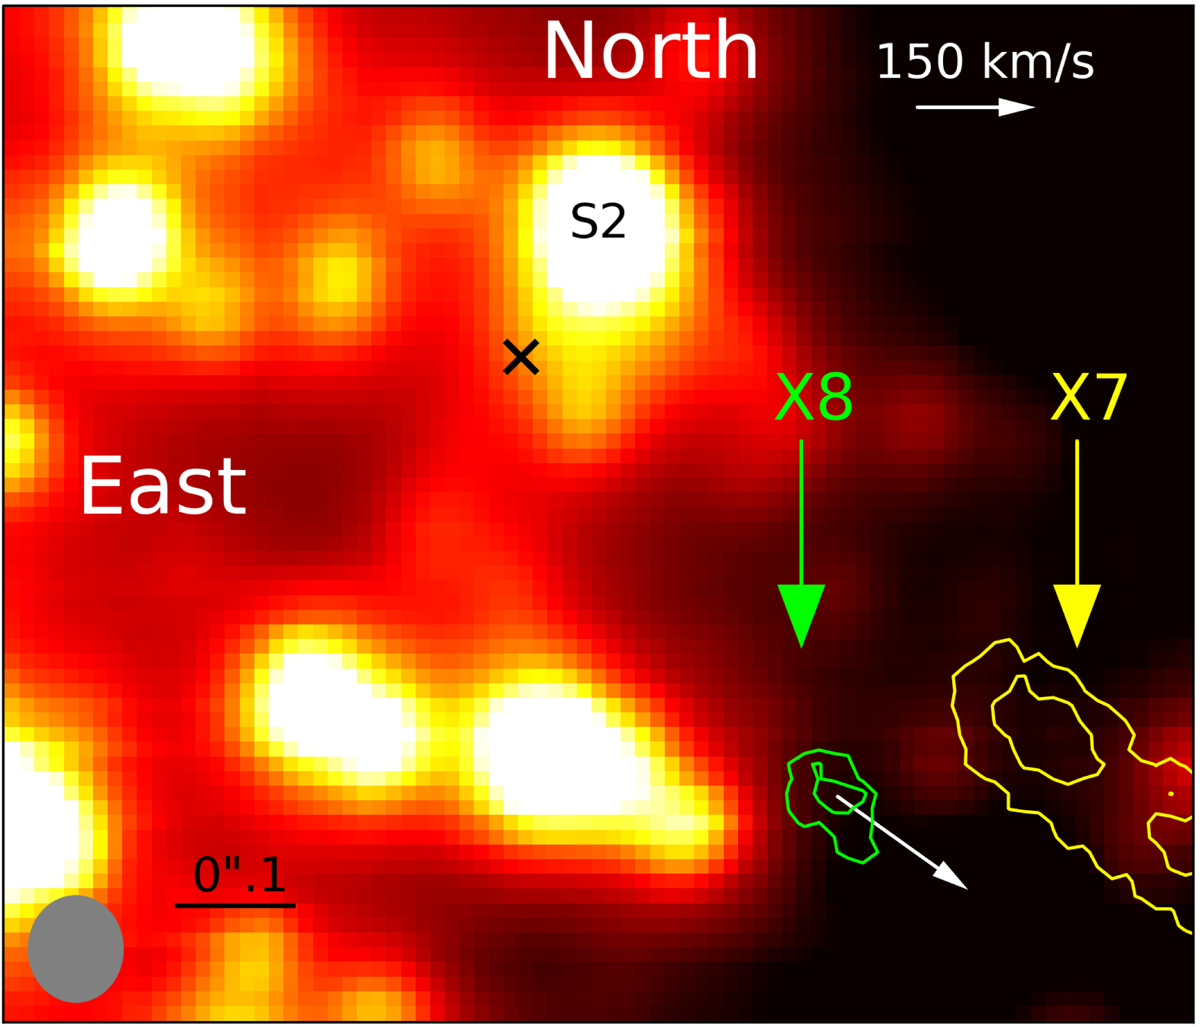
Finding chart of the GC. This is a K-band image of the 2015 observations and is extracted from the associated H+K SINFONI data cube. In the lower left corner, the extracted PSF of S2 of the data cube is shown as a gray elliptical patch. The black cross next to the B2V star S2 marks the position of Sgr A*. North is up, east is to the left. The length of the black bar in the lower left quadrant is ![]() or 100 mas. The green contour indicates the position of the X8 source, and the yellow contour determines the bow-shock object X7. These contours are based on the peak intensity (green line: 62% and 84%, yellow line: 42% and 73%) of the blueshifted Brγ line maps that are extracted from the H+K SINFONI data cube. The full size of the bow-shock source X7 cannot be shown because the FOV is limited by the observations.
or 100 mas. The green contour indicates the position of the X8 source, and the yellow contour determines the bow-shock object X7. These contours are based on the peak intensity (green line: 62% and 84%, yellow line: 42% and 73%) of the blueshifted Brγ line maps that are extracted from the H+K SINFONI data cube. The full size of the bow-shock source X7 cannot be shown because the FOV is limited by the observations.
Current usage metrics show cumulative count of Article Views (full-text article views including HTML views, PDF and ePub downloads, according to the available data) and Abstracts Views on Vision4Press platform.
Data correspond to usage on the plateform after 2015. The current usage metrics is available 48-96 hours after online publication and is updated daily on week days.
Initial download of the metrics may take a while.