Fig. 4
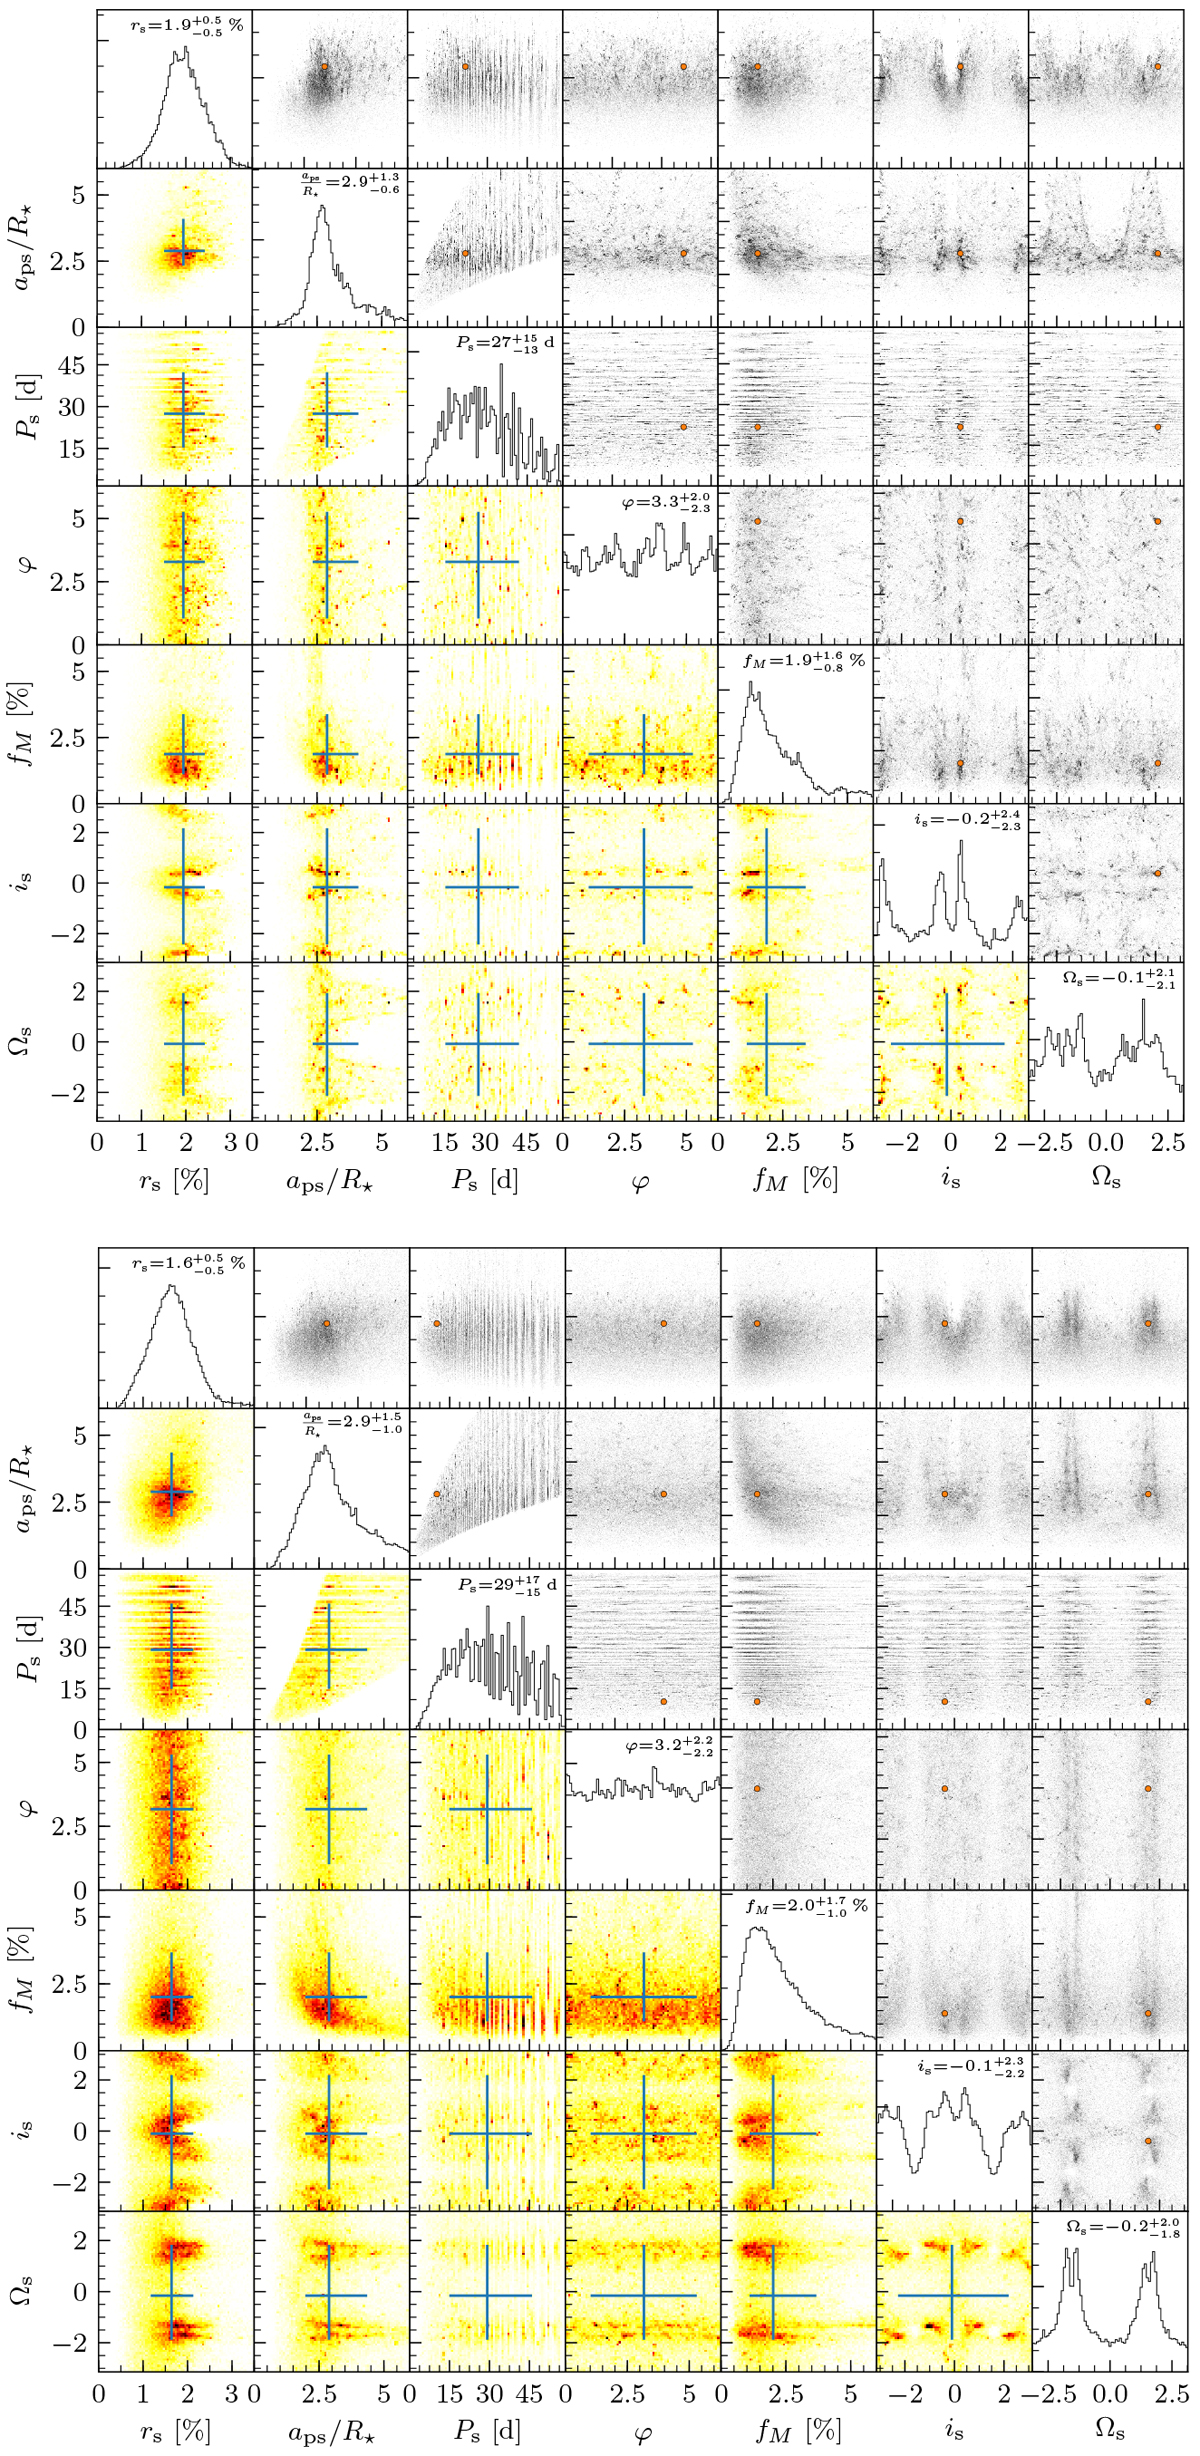
Posterior distributions of a parallel tempering ensemble MCMC sampling of the combined Kepler and WFC3 data with our planet-moon model. Top: results for the original data from Teachey & Kipping (2018). Bottom: results for our own detrending of the Kepler and WFC3 data. In both figures, scatter plots are shown with black dots above the diagonal, and projected histograms are shown as colored pixels below the diagonal. The most likely parameters are denoted with an orange point in the scatter plots. Histograms of the moon-to-star radius ratio rs, scaled semimajor axis of the planet-moon system (aps∕R⋆), satellite orbital period (Ps), satellite orbital phase (φ), moon-to-planet mass ratio (fM), orbital inclination of the satellite with respect to our line of sight (is), and the orientation of the ascending node of the satellite orbit (Ωs) are shown on the diagonal. Median values and standard deviations are indicated with error bars in the histograms.
Current usage metrics show cumulative count of Article Views (full-text article views including HTML views, PDF and ePub downloads, according to the available data) and Abstracts Views on Vision4Press platform.
Data correspond to usage on the plateform after 2015. The current usage metrics is available 48-96 hours after online publication and is updated daily on week days.
Initial download of the metrics may take a while.