Fig. 2
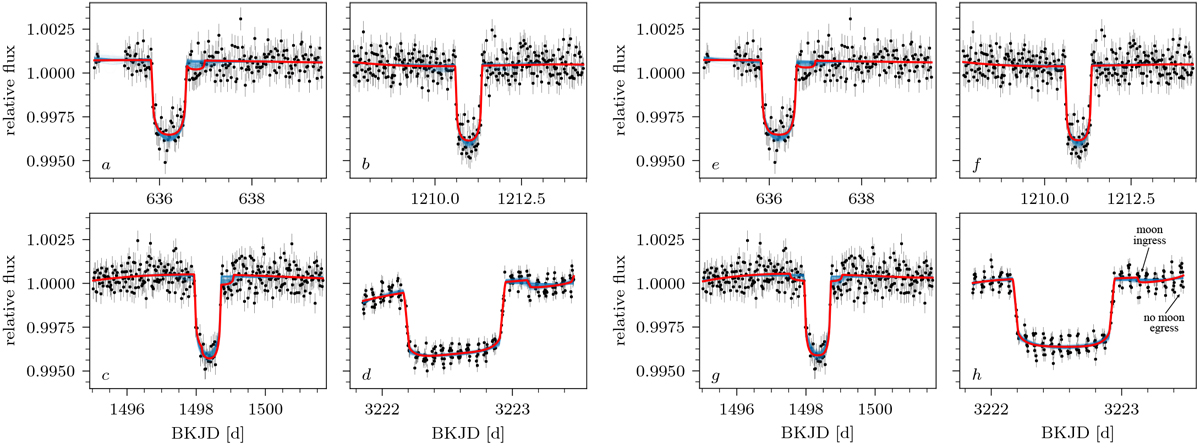
Orbital solutions for Kepler-1625 b and its suspected exomoon based on the combined Kepler and Hubble data. Panels a–c: Kepler PDCSAP flux. Panel d: quadratic detrending of the Hubble data from Teachey & Kipping (2018). The blue curves show 1000 realizations of our PTMCMC fitting of a planet-moon model. Our most likely solution (red line) is very similar to the one found by Teachey & Kipping (2018), but differs significantly from the one initially found by Teachey et al. (2018). Panels e–g: Kepler PDCSAP flux. Panel h: our own detrending of the Hubble light curve (in parallel to the fitting). The ingress and egress of the model moon are denoted with arrows and labels in panel has an example.
Current usage metrics show cumulative count of Article Views (full-text article views including HTML views, PDF and ePub downloads, according to the available data) and Abstracts Views on Vision4Press platform.
Data correspond to usage on the plateform after 2015. The current usage metrics is available 48-96 hours after online publication and is updated daily on week days.
Initial download of the metrics may take a while.