Fig. 1
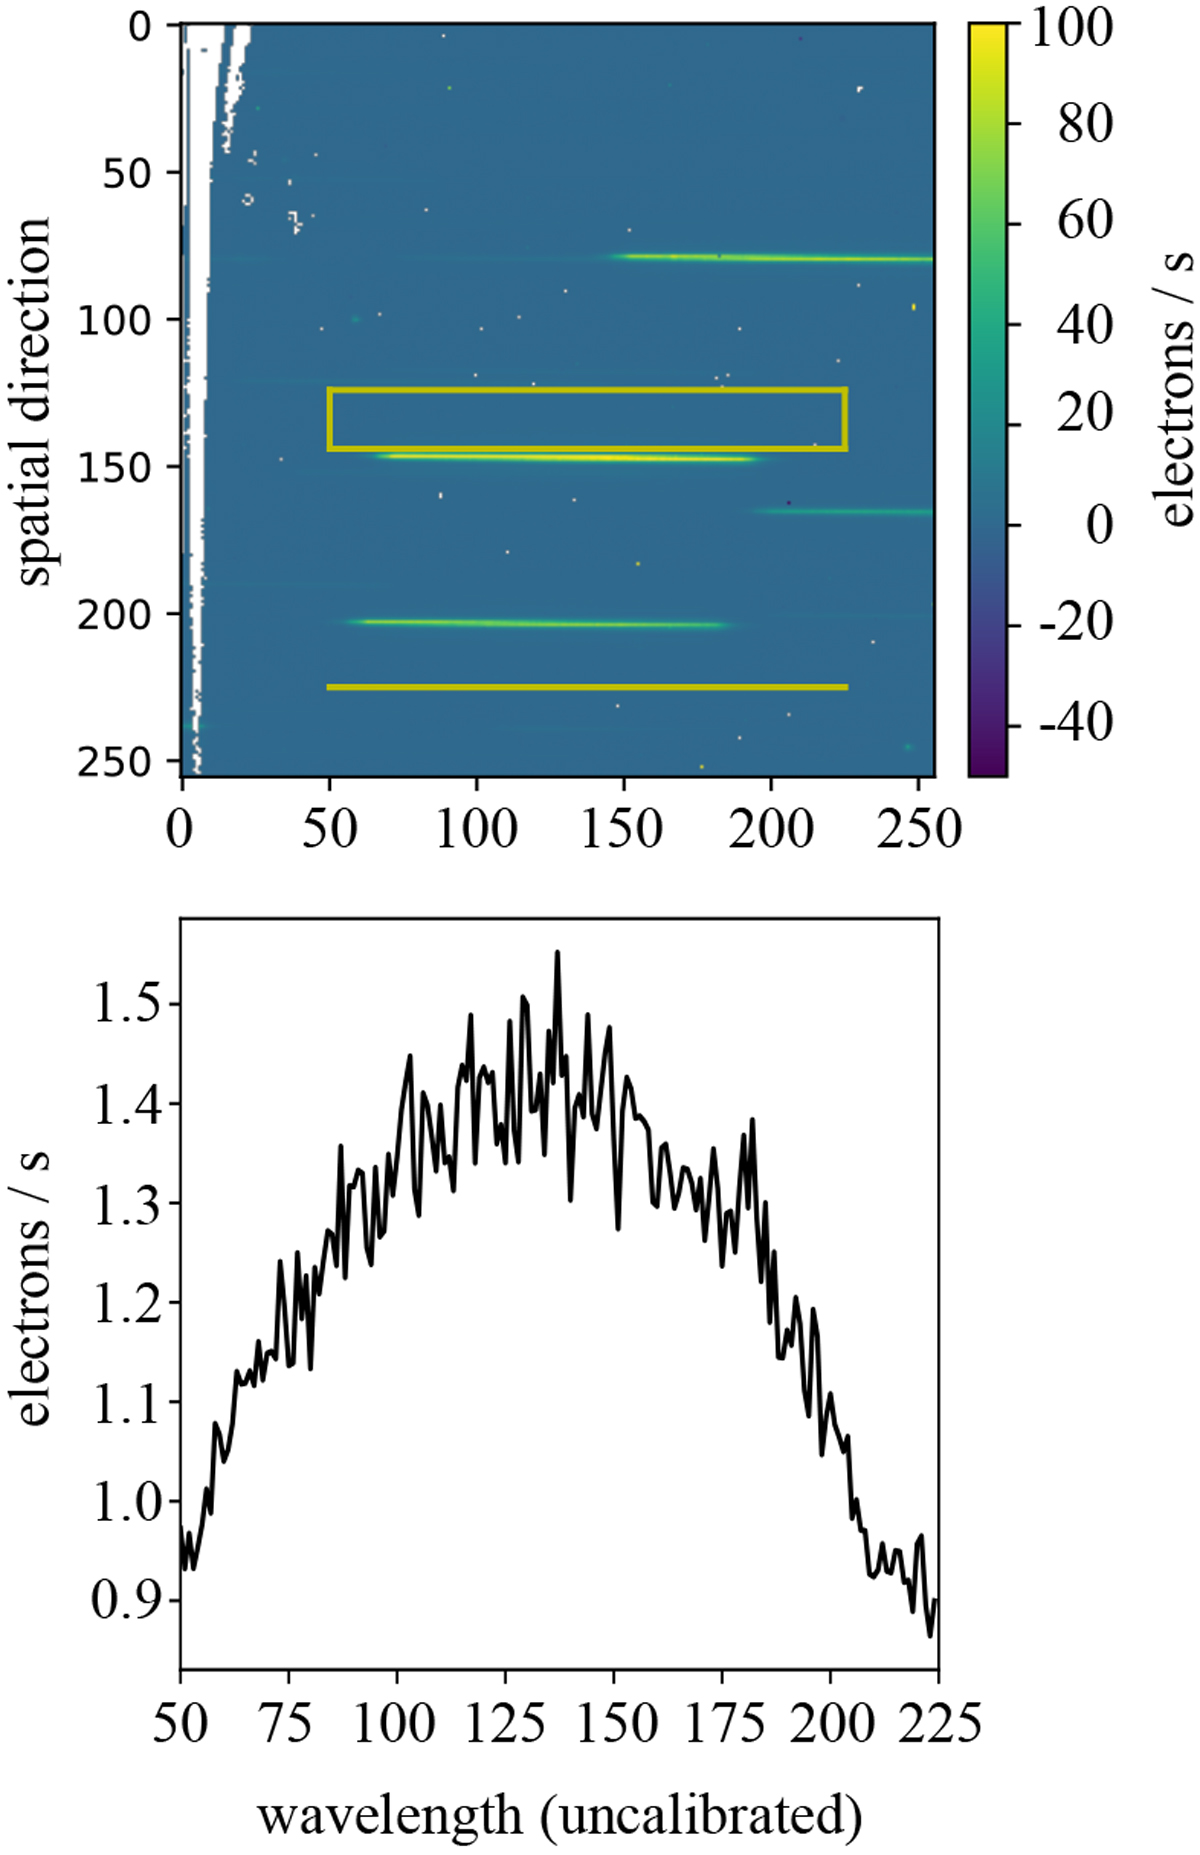
Top: example of a WFC3 exposure of Kepler-1625. The abscissa shows the column pixel prior to wavelength calibration. The yellow box indicates the region used for background estimation. The spectrum of Kepler-1625 is at the center of the frame, around row 150 in the spatial direction, while several contaminant sources are evident in other regions of the detector. The color bar illustrates the measured charge values. Bottom: background value measured across the rows of the same frame.
Current usage metrics show cumulative count of Article Views (full-text article views including HTML views, PDF and ePub downloads, according to the available data) and Abstracts Views on Vision4Press platform.
Data correspond to usage on the plateform after 2015. The current usage metrics is available 48-96 hours after online publication and is updated daily on week days.
Initial download of the metrics may take a while.