Free Access
Fig. 8.
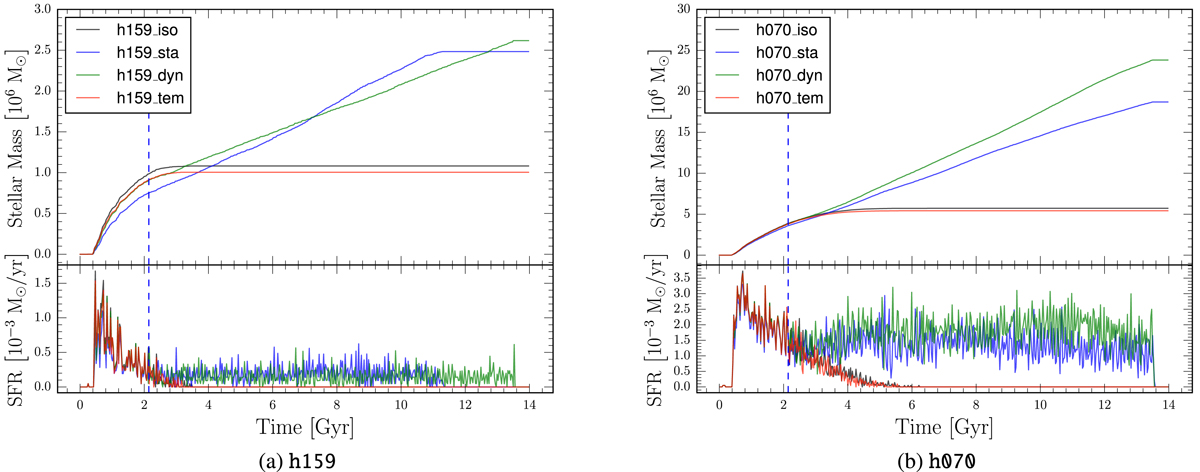
Time evolution of the cumulative stellar mass (top) and star formation rate (bottom) of model h159 (left) and h070 (right), in the four models: isolated (black), EM-{} (blue), EM-{ρ} (green) and EM-{ρ, T} (red). The vertical dashed line indicates the injection time for models EM-{}, EM-{ρ} and EM-{ρ, T}.
Current usage metrics show cumulative count of Article Views (full-text article views including HTML views, PDF and ePub downloads, according to the available data) and Abstracts Views on Vision4Press platform.
Data correspond to usage on the plateform after 2015. The current usage metrics is available 48-96 hours after online publication and is updated daily on week days.
Initial download of the metrics may take a while.