Fig. 7.
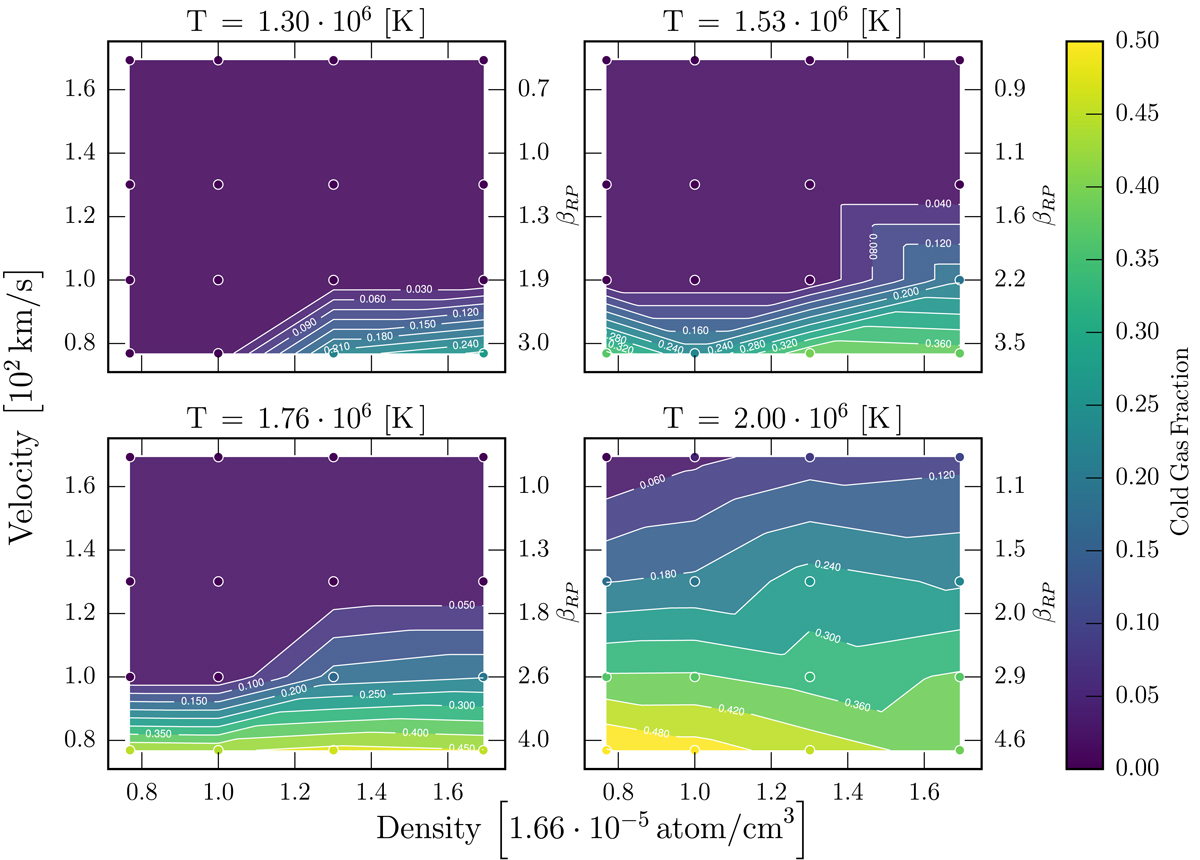
Each plot represents the cold gas fraction at z = 0 of h159 as a function of the hot halo density and satellite velocity for different halo temperatures. The white circles are the simulations done. βRP is given on the right axis of each graph. Usually, the RPS is described only through density and velocity, but here the temperature dependency is shown to have an important impact.
Current usage metrics show cumulative count of Article Views (full-text article views including HTML views, PDF and ePub downloads, according to the available data) and Abstracts Views on Vision4Press platform.
Data correspond to usage on the plateform after 2015. The current usage metrics is available 48-96 hours after online publication and is updated daily on week days.
Initial download of the metrics may take a while.