Fig. 5.
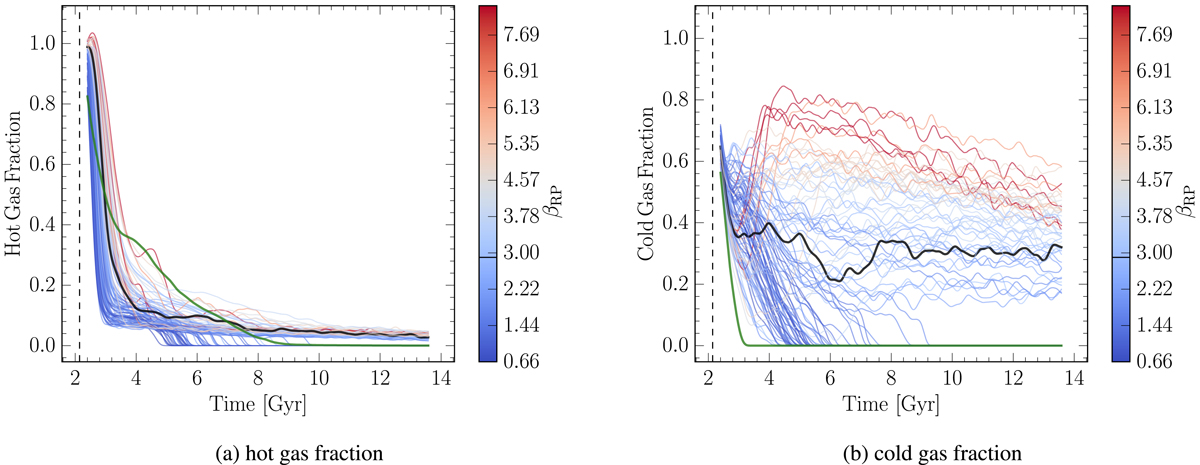
Time evolution of the gas fraction of the dwarf galaxy h159 evolving through a wind tunnel simulation (see Table 2 for the list of parameters). Left panel: hot gas fraction contained in one virial radius. Right panel: cold gas fraction contained in 0.1 virial radius. The colour of each line reflect the corresponding βt. In both panels, the green and black lines correspond to the isolated and fiducial wind tunnel model respectively. A moving average has been applied with a gaussian kernel (standard deviation of ∼100 Myr in a window of −500 to 500 Myr) to reduce the noise. Due to this filter, the earliest times are removed and the different curves start at different fraction.
Current usage metrics show cumulative count of Article Views (full-text article views including HTML views, PDF and ePub downloads, according to the available data) and Abstracts Views on Vision4Press platform.
Data correspond to usage on the plateform after 2015. The current usage metrics is available 48-96 hours after online publication and is updated daily on week days.
Initial download of the metrics may take a while.