Fig. 11.
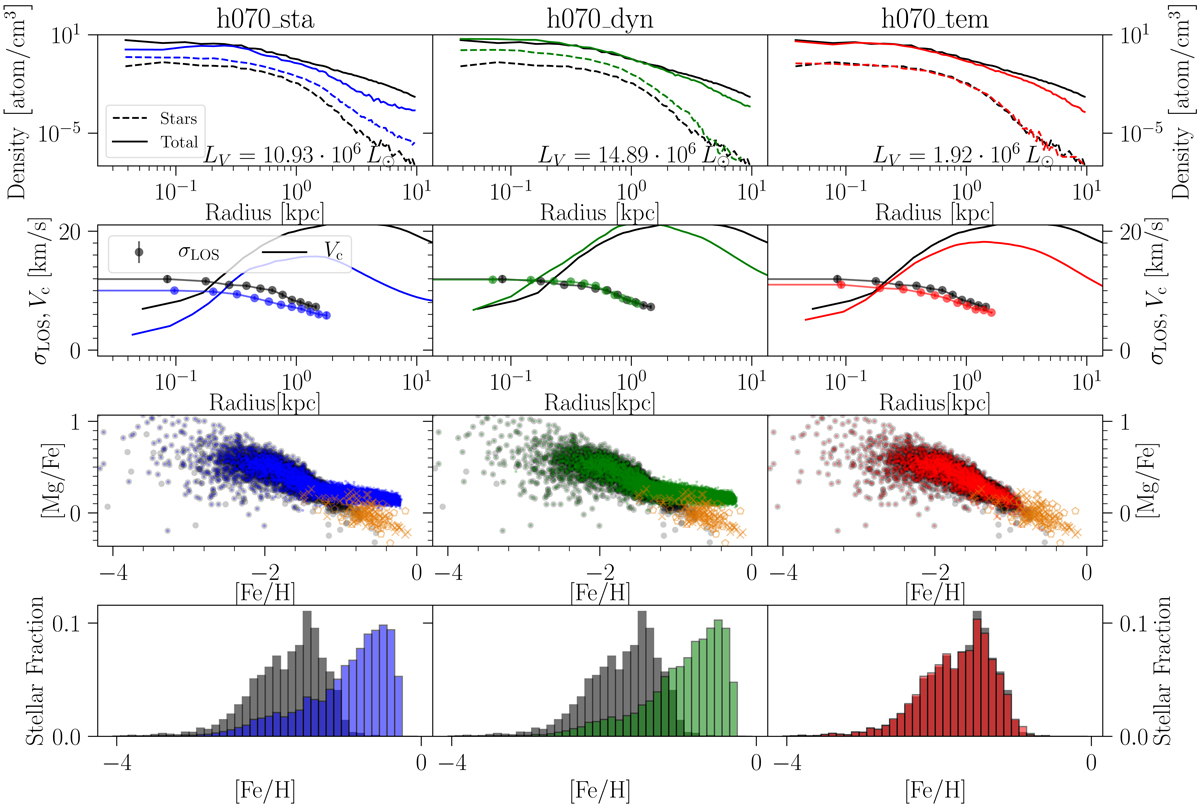
Properties of the different simulations in a moving box. From left to right, the simulations correspond to h070_sta (blue), h070_dyn (green) and h070_tem (red) and are compared to the isolated model h070_iso in grey. In the first line, the density profile is shown for the total mass (straight lines) and the stellar mass (dashed lines). In the second line, the circular velocity and line of sight velocity dispersion are shown. In the third line, the stellar [Mg/Fe] vs. [Fe/H] distribution is shown. The orange crosses (pentagons) are observations of the LMC bar (inner disc) (Van der Swaelmen et al. 2013). In the last line, the metallicity distribution is shown.
Current usage metrics show cumulative count of Article Views (full-text article views including HTML views, PDF and ePub downloads, according to the available data) and Abstracts Views on Vision4Press platform.
Data correspond to usage on the plateform after 2015. The current usage metrics is available 48-96 hours after online publication and is updated daily on week days.
Initial download of the metrics may take a while.