Free Access
Fig. 1.
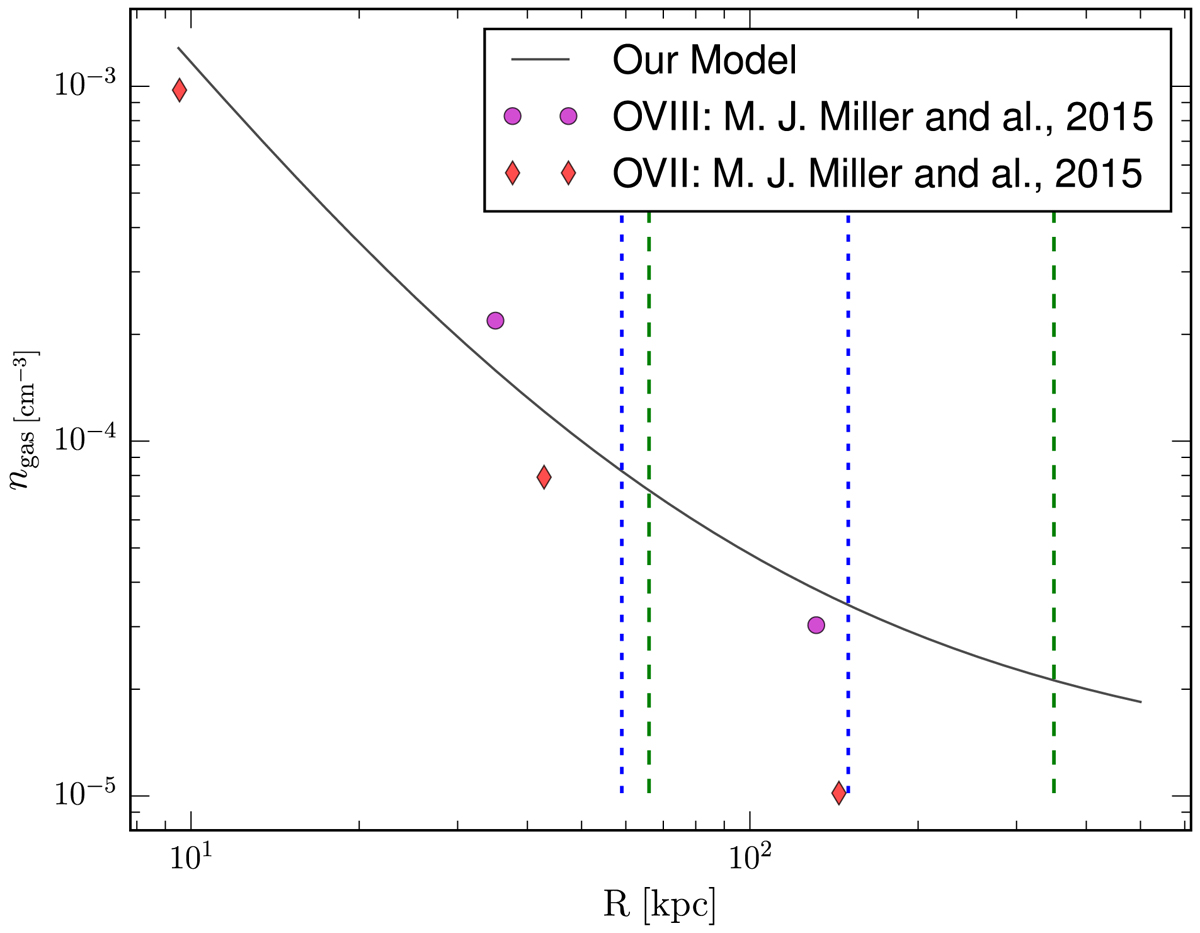
Gas density model of the MilkyWay’s hot halo (black line) compared to observational data from Miller & Bregman (2015). The two vertical lines correspond to the minimal pericentre and maximal apocentre of the satellite orbits explored in this work (blue static potential and green evolving potential).
Current usage metrics show cumulative count of Article Views (full-text article views including HTML views, PDF and ePub downloads, according to the available data) and Abstracts Views on Vision4Press platform.
Data correspond to usage on the plateform after 2015. The current usage metrics is available 48-96 hours after online publication and is updated daily on week days.
Initial download of the metrics may take a while.