Fig. 9
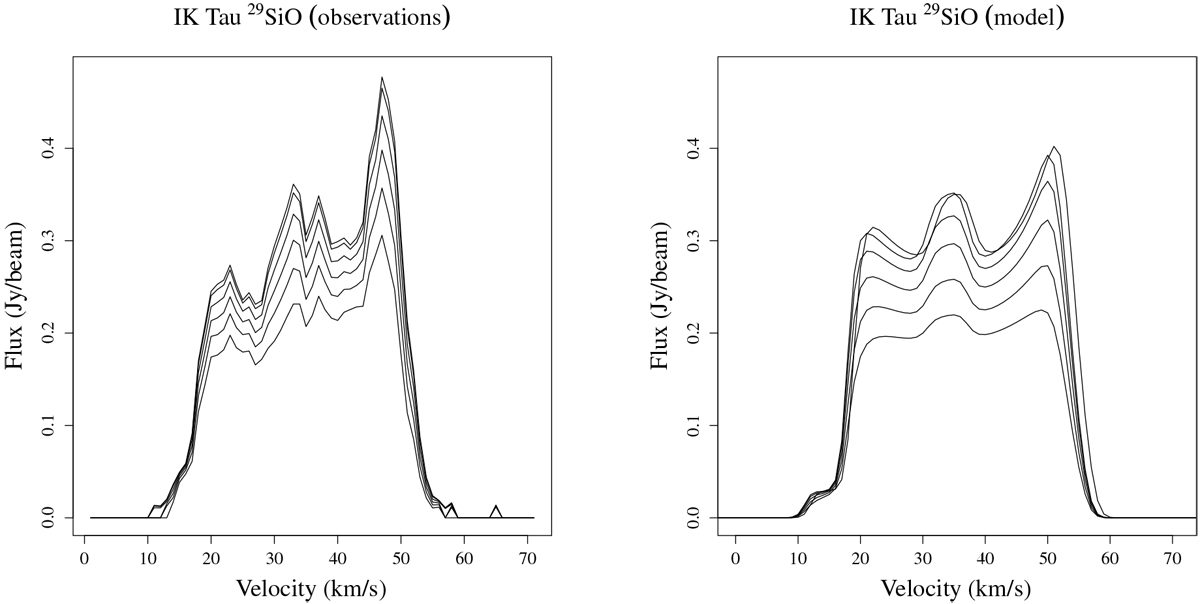
Spectra of the innermost regions of the envelope. The azimuthally averaged observed emission is shown to the left and the model to the right. Six positions are shown separated by 0.′′125; the innermost is the most intense. The model reproduces to some extent the three peaks and the self-absorption that happens in the blue-shifted side of the spectra.
Current usage metrics show cumulative count of Article Views (full-text article views including HTML views, PDF and ePub downloads, according to the available data) and Abstracts Views on Vision4Press platform.
Data correspond to usage on the plateform after 2015. The current usage metrics is available 48-96 hours after online publication and is updated daily on week days.
Initial download of the metrics may take a while.