Fig. 7
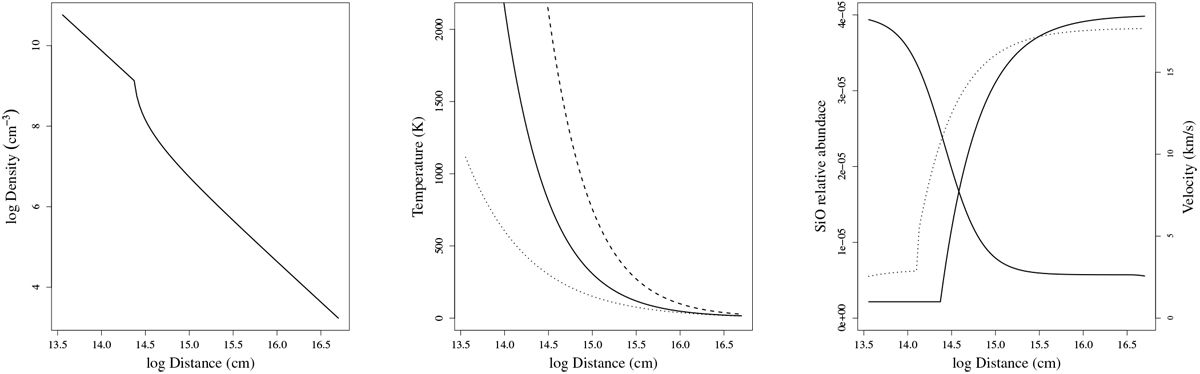
Total density, kinetic temperature, molecular abundance, and velocity profile used for the models of Fig. 5 for IK Tau. We also show for comparison the temperatures obtained by Bujarrabal et al. (1989; dashed line) and Decin et al. (2010; dotted line). In the velocity plot we include, for comparison, the velocity by Decin et al. (2010; dotted line). The velocity stays constant at 1 km s−1 up to the distance Rd, and then gradually increases as described in Eqs. (3) and (4).
Current usage metrics show cumulative count of Article Views (full-text article views including HTML views, PDF and ePub downloads, according to the available data) and Abstracts Views on Vision4Press platform.
Data correspond to usage on the plateform after 2015. The current usage metrics is available 48-96 hours after online publication and is updated daily on week days.
Initial download of the metrics may take a while.