Free Access
Fig. A.6
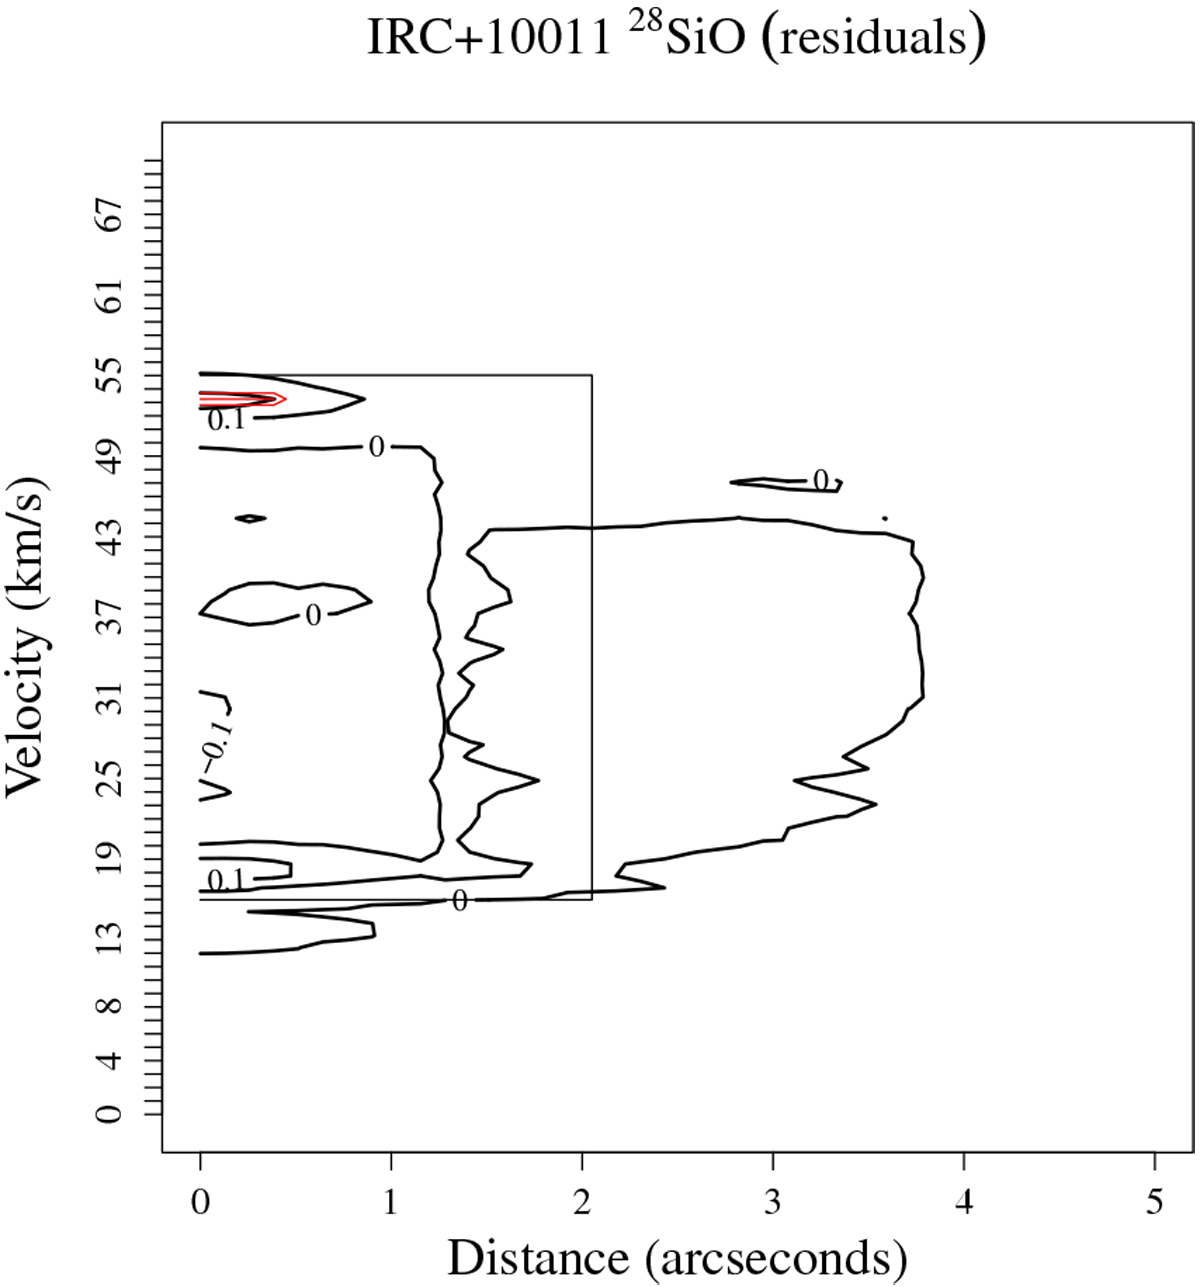
Residual map that results from subtracting model from observations, for IK Tau, 28SiO emission. The rms of the residuals is calculated in the area enclosed by the rectangle. The red contours illustrate the regions where the maximum residual, in absolute value, is located.
Current usage metrics show cumulative count of Article Views (full-text article views including HTML views, PDF and ePub downloads, according to the available data) and Abstracts Views on Vision4Press platform.
Data correspond to usage on the plateform after 2015. The current usage metrics is available 48-96 hours after online publication and is updated daily on week days.
Initial download of the metrics may take a while.