Free Access
Fig. A.1
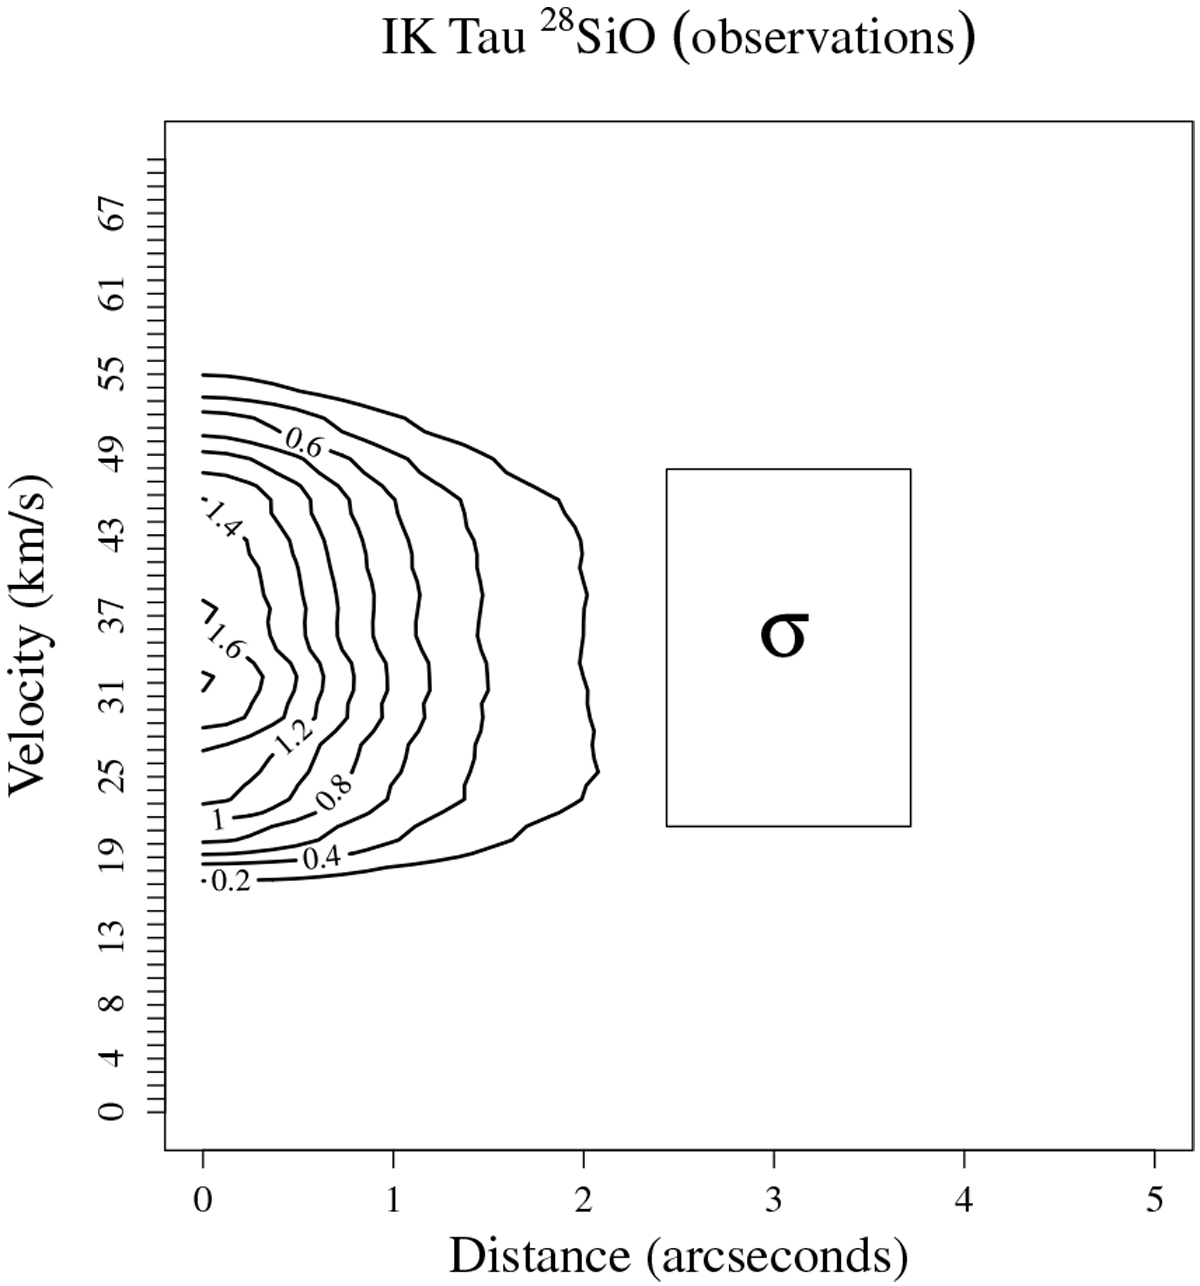
Azimuthally averaged 28SiO emission as a function of distance and LSR velocity for IK Tau. The rectangle outside the contours represents the area where the rms (σ) was calculated. We chose this region to take into account errors that could have resulted from the cleaning process.
Current usage metrics show cumulative count of Article Views (full-text article views including HTML views, PDF and ePub downloads, according to the available data) and Abstracts Views on Vision4Press platform.
Data correspond to usage on the plateform after 2015. The current usage metrics is available 48-96 hours after online publication and is updated daily on week days.
Initial download of the metrics may take a while.