Fig. 3
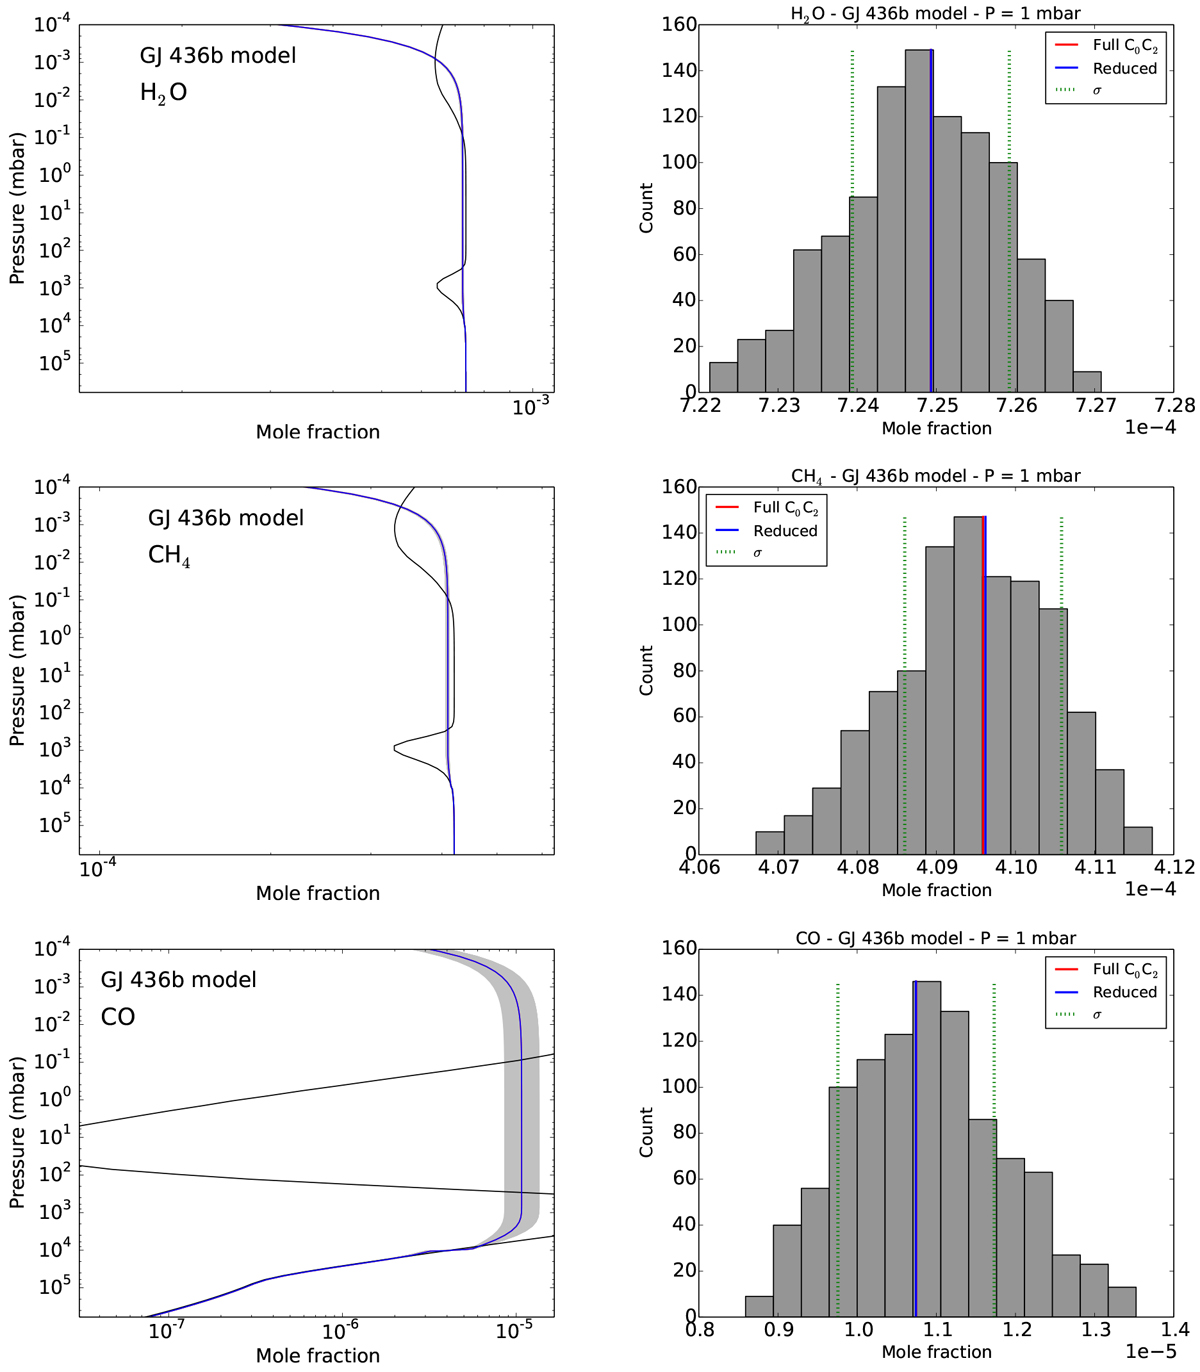
Left: vertical abundance profiles determined after 1000 runs with the full chemical scheme (grey lines) for H2O, CH4, and CO. The nominal results of the full chemical scheme (red lines), thermochemical equilibrium (black lines), and results obtained with the reduced scheme (blue lines) are also shown. Right: corresponding distribution of abundances at 1 mbar represented with grey bars, with nominal abundances of the full scheme (red lines), abundances obtained with the reduced scheme (blue lines), and the 1-σ intervals around the nominal abundances (green dotted lines). Blue and red lines are very close on each plot.
Current usage metrics show cumulative count of Article Views (full-text article views including HTML views, PDF and ePub downloads, according to the available data) and Abstracts Views on Vision4Press platform.
Data correspond to usage on the plateform after 2015. The current usage metrics is available 48-96 hours after online publication and is updated daily on week days.
Initial download of the metrics may take a while.