Fig. 2
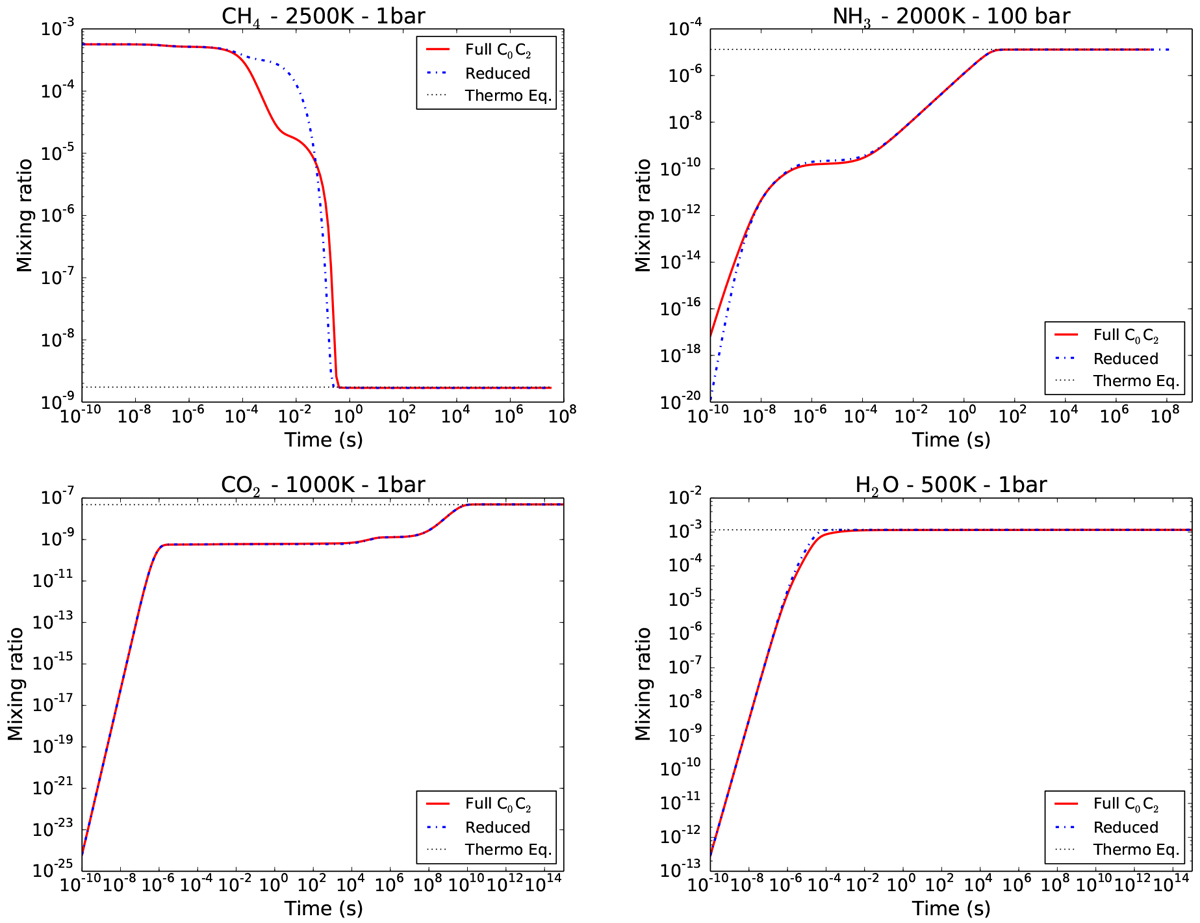
Temporal evolution of abundances for CH4, NH3, CO2, and H2O at different temperature and pressure conditions, as labeled in each figure. Abundances are calculated with the full chemical scheme (red solid lines) and with the reduced scheme (blue dot-dashed lines). These abundances are compared with the thermochemical equilibrium value (black dotted lines). Initial conditions are solar abundances spread into H2, He, CH4, O(3P), and N2.
Current usage metrics show cumulative count of Article Views (full-text article views including HTML views, PDF and ePub downloads, according to the available data) and Abstracts Views on Vision4Press platform.
Data correspond to usage on the plateform after 2015. The current usage metrics is available 48-96 hours after online publication and is updated daily on week days.
Initial download of the metrics may take a while.