Open Access
Fig. 13.
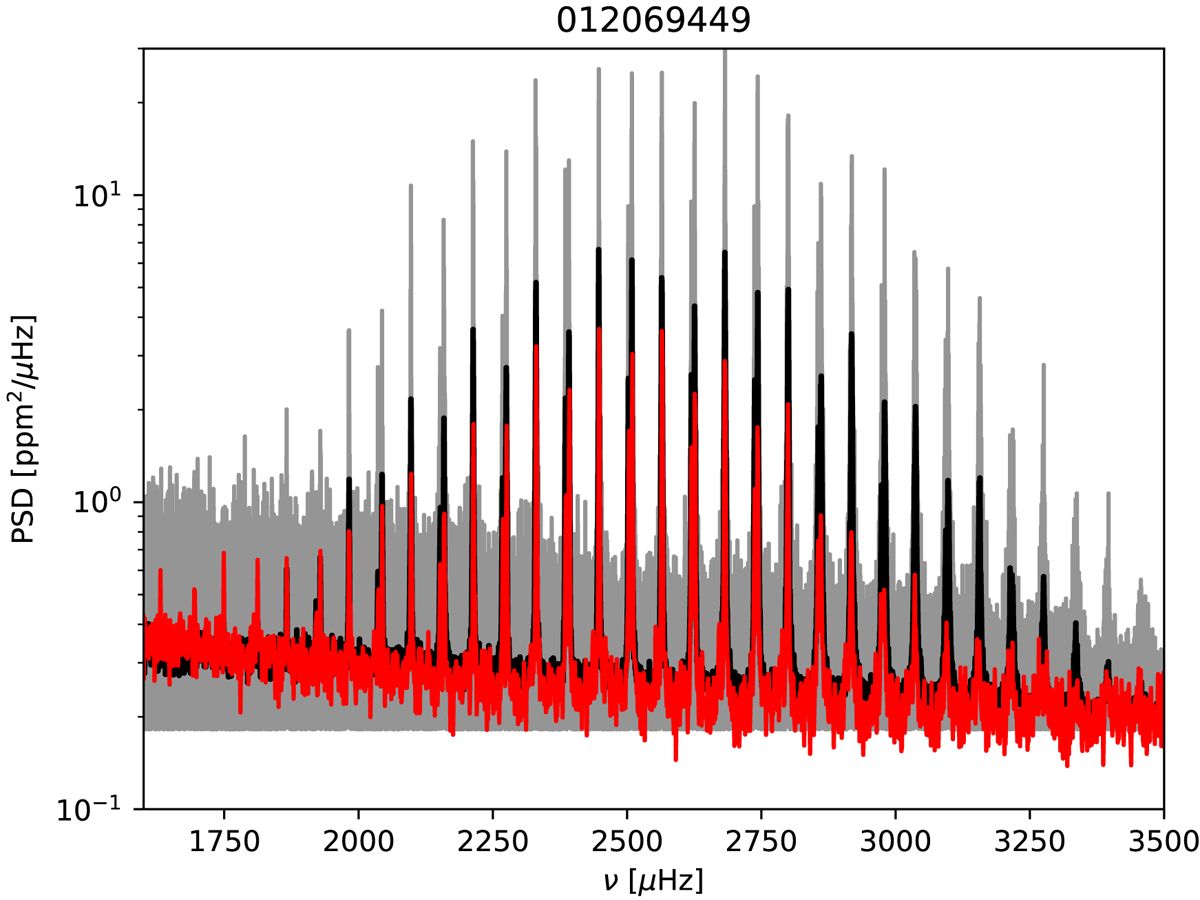
Comparison of a simulated PSD and the one obtained from Kepler observations of the main sequence star 16 Cyg B (KIC 12069449). The grey and black lines have the same meaning as in Fig. 12. The red curve corresponds to the smoothed PSD obtained from the observations.
Current usage metrics show cumulative count of Article Views (full-text article views including HTML views, PDF and ePub downloads, according to the available data) and Abstracts Views on Vision4Press platform.
Data correspond to usage on the plateform after 2015. The current usage metrics is available 48-96 hours after online publication and is updated daily on week days.
Initial download of the metrics may take a while.