Fig. 11.
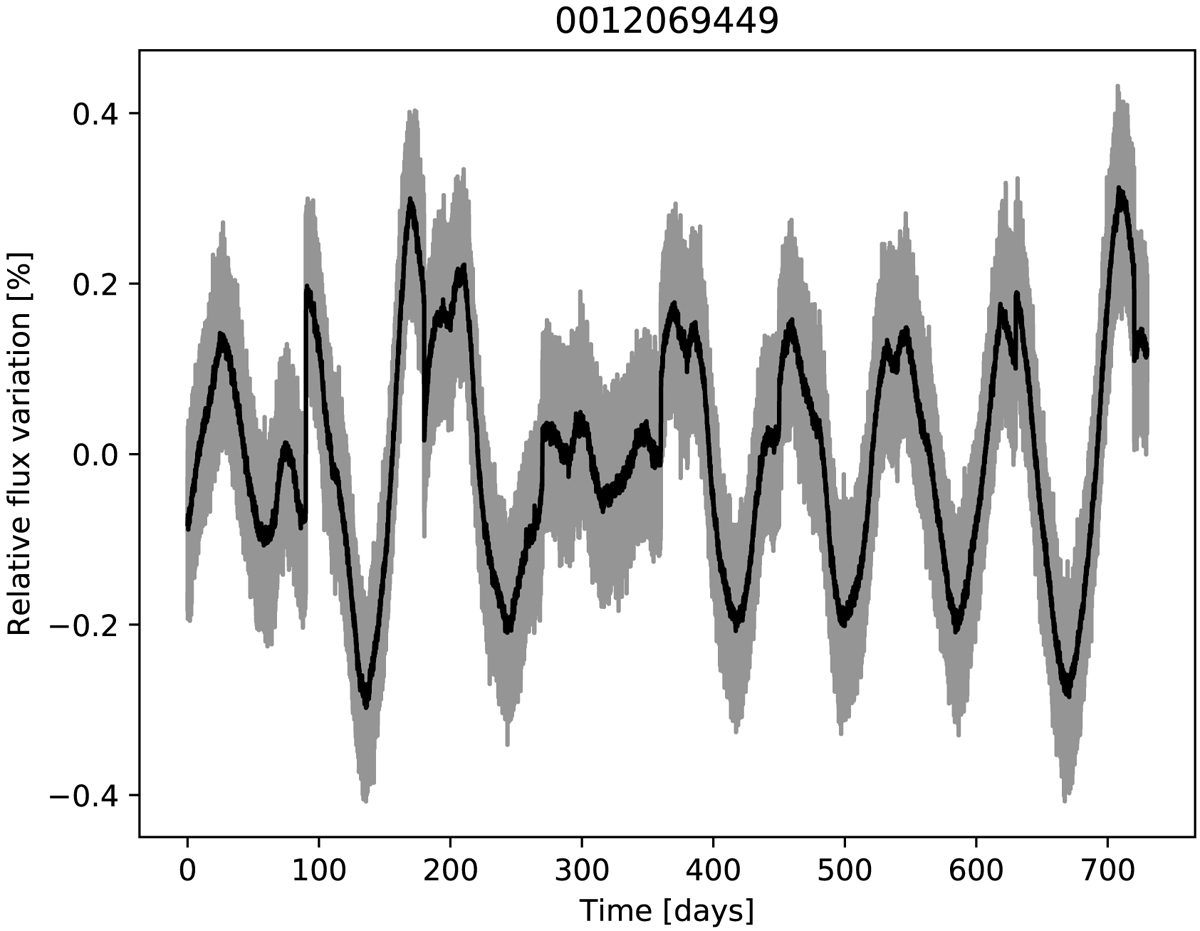
Simulated light-curve for the main sequence star 16 Cyg B (KIC 12069449) with simulation parameters representative of a V = 10.0 PLATO target observed in EOL conditions with 24 cameras (see the details given in Sect. 6.1). The grey curve corresponds to the raw light-curve while the black ones is the light-curve averaged over one hour.
Current usage metrics show cumulative count of Article Views (full-text article views including HTML views, PDF and ePub downloads, according to the available data) and Abstracts Views on Vision4Press platform.
Data correspond to usage on the plateform after 2015. The current usage metrics is available 48-96 hours after online publication and is updated daily on week days.
Initial download of the metrics may take a while.