Fig. 8.
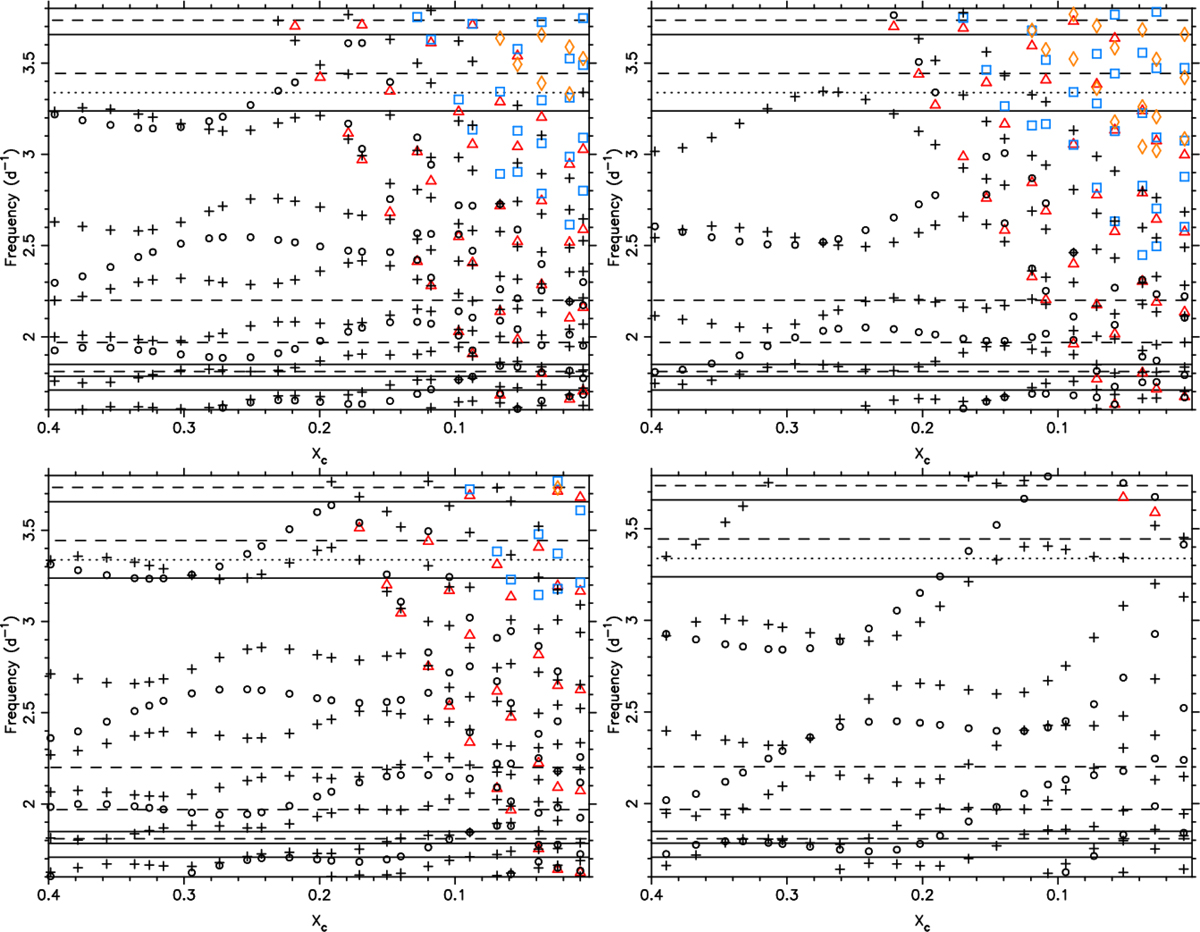
Evolution of the zonal mode frequencies of stellar models with input parameters M = 6 M⊙, X = 0.72, Z = 0.020, fov = 0.05, and Dmix = 1 cm2 s−1 (upper left panel), M = 8 M⊙, X = 0.70, Z = 0.020, fov = 0.05, and Dmix = 100 cm2 s−1 (upper right panel), M = 6 M⊙, X = 0.72, Z = 0.012, fov = 0.05, and Dmix = 1 cm2 s−1 (bottom left panel), M = 8 M⊙, X = 0.70, Z = 0.020, fov = 0.01, and Dmix = 100 cm2 s−1 (bottom right panel). The panels show the zonal mode frequencies in the region of the measured frequencies of HD 170580, which are indicated as horizontal lines (dotted: l = 2, full: l = 1, dashed: unknown l). The model frequencies are coded as black circles: l = 1, n < 0, black plus signs: l = 2, n < 0, red triangles: l = 0, blue squares: l = 1, n ≥ 0, orange diamonds: l = 2, n ≥ 0.
Current usage metrics show cumulative count of Article Views (full-text article views including HTML views, PDF and ePub downloads, according to the available data) and Abstracts Views on Vision4Press platform.
Data correspond to usage on the plateform after 2015. The current usage metrics is available 48-96 hours after online publication and is updated daily on week days.
Initial download of the metrics may take a while.