Free Access
Fig. 5.
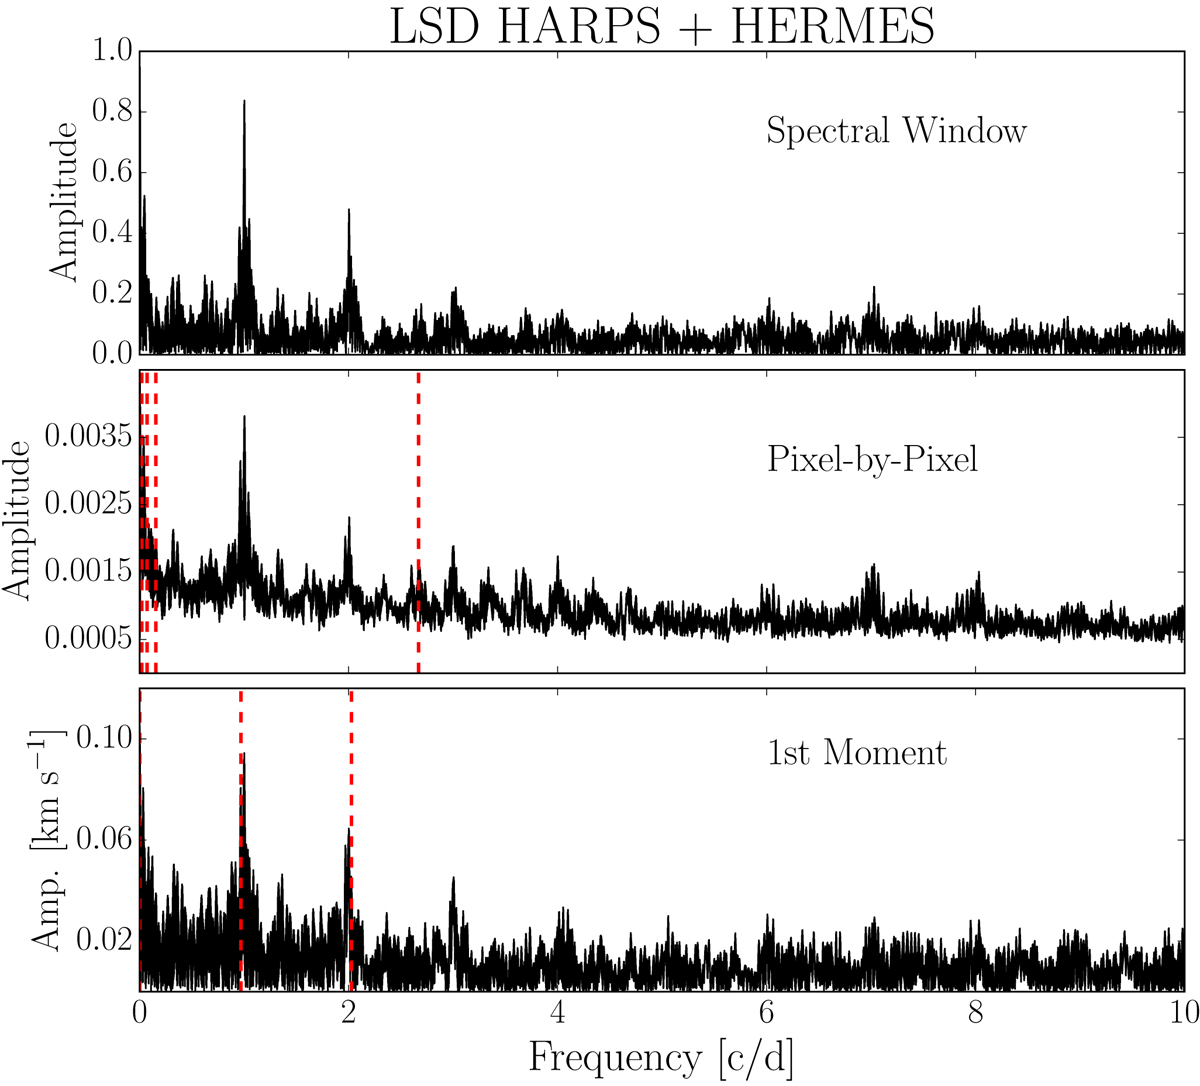
Fourier spectra based on the Pixel-by-Pixel method (second panel) and the first moment (third panel) for the combined HARPS and HERMES LSD profiles. Top panel: spectral window. Vertical dashed lines indicate the positions of frequencies with S/N ≥ 4 during pre-whitening.
Current usage metrics show cumulative count of Article Views (full-text article views including HTML views, PDF and ePub downloads, according to the available data) and Abstracts Views on Vision4Press platform.
Data correspond to usage on the plateform after 2015. The current usage metrics is available 48-96 hours after online publication and is updated daily on week days.
Initial download of the metrics may take a while.