Fig. 4.
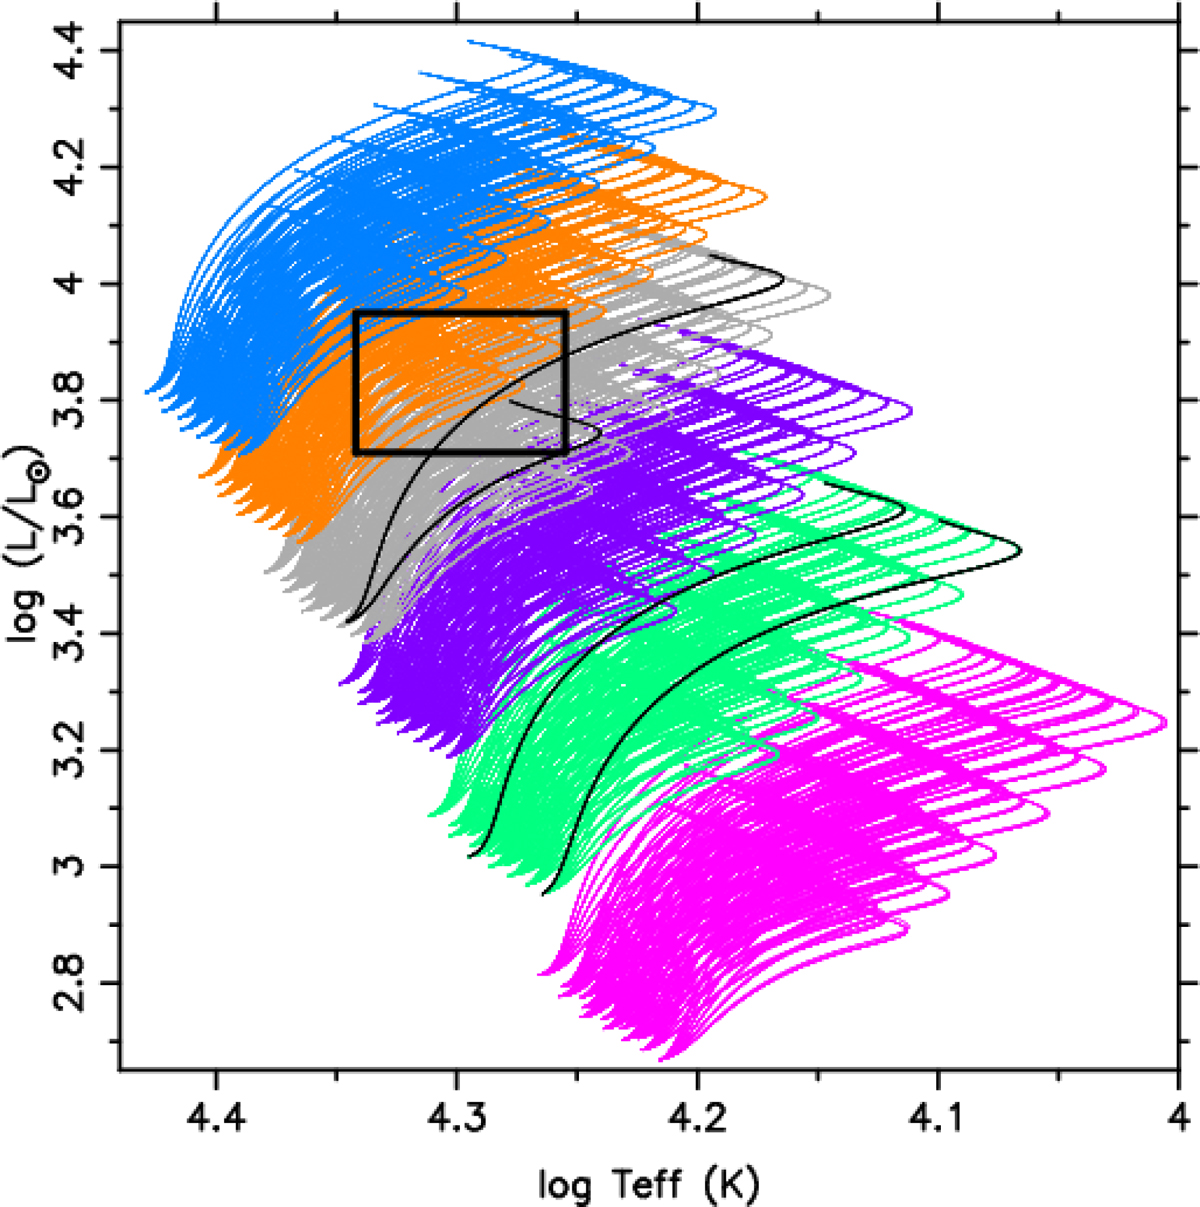
Herzsprung-Russell diagram with the 240 evolutionary tracks per mass in the SpaceInn grid for the masses 5 (pink), 6 (green), 7 (purple), 8 (grey), 9 (orange), and 10 (blue) M⊙, along with the 2σ error box of HD 170580 based on Gaia DR2 data and spectroscopy. The pulsation modes of the four tracks in black are shown in Fig. 8.
Current usage metrics show cumulative count of Article Views (full-text article views including HTML views, PDF and ePub downloads, according to the available data) and Abstracts Views on Vision4Press platform.
Data correspond to usage on the plateform after 2015. The current usage metrics is available 48-96 hours after online publication and is updated daily on week days.
Initial download of the metrics may take a while.