Fig. 3.
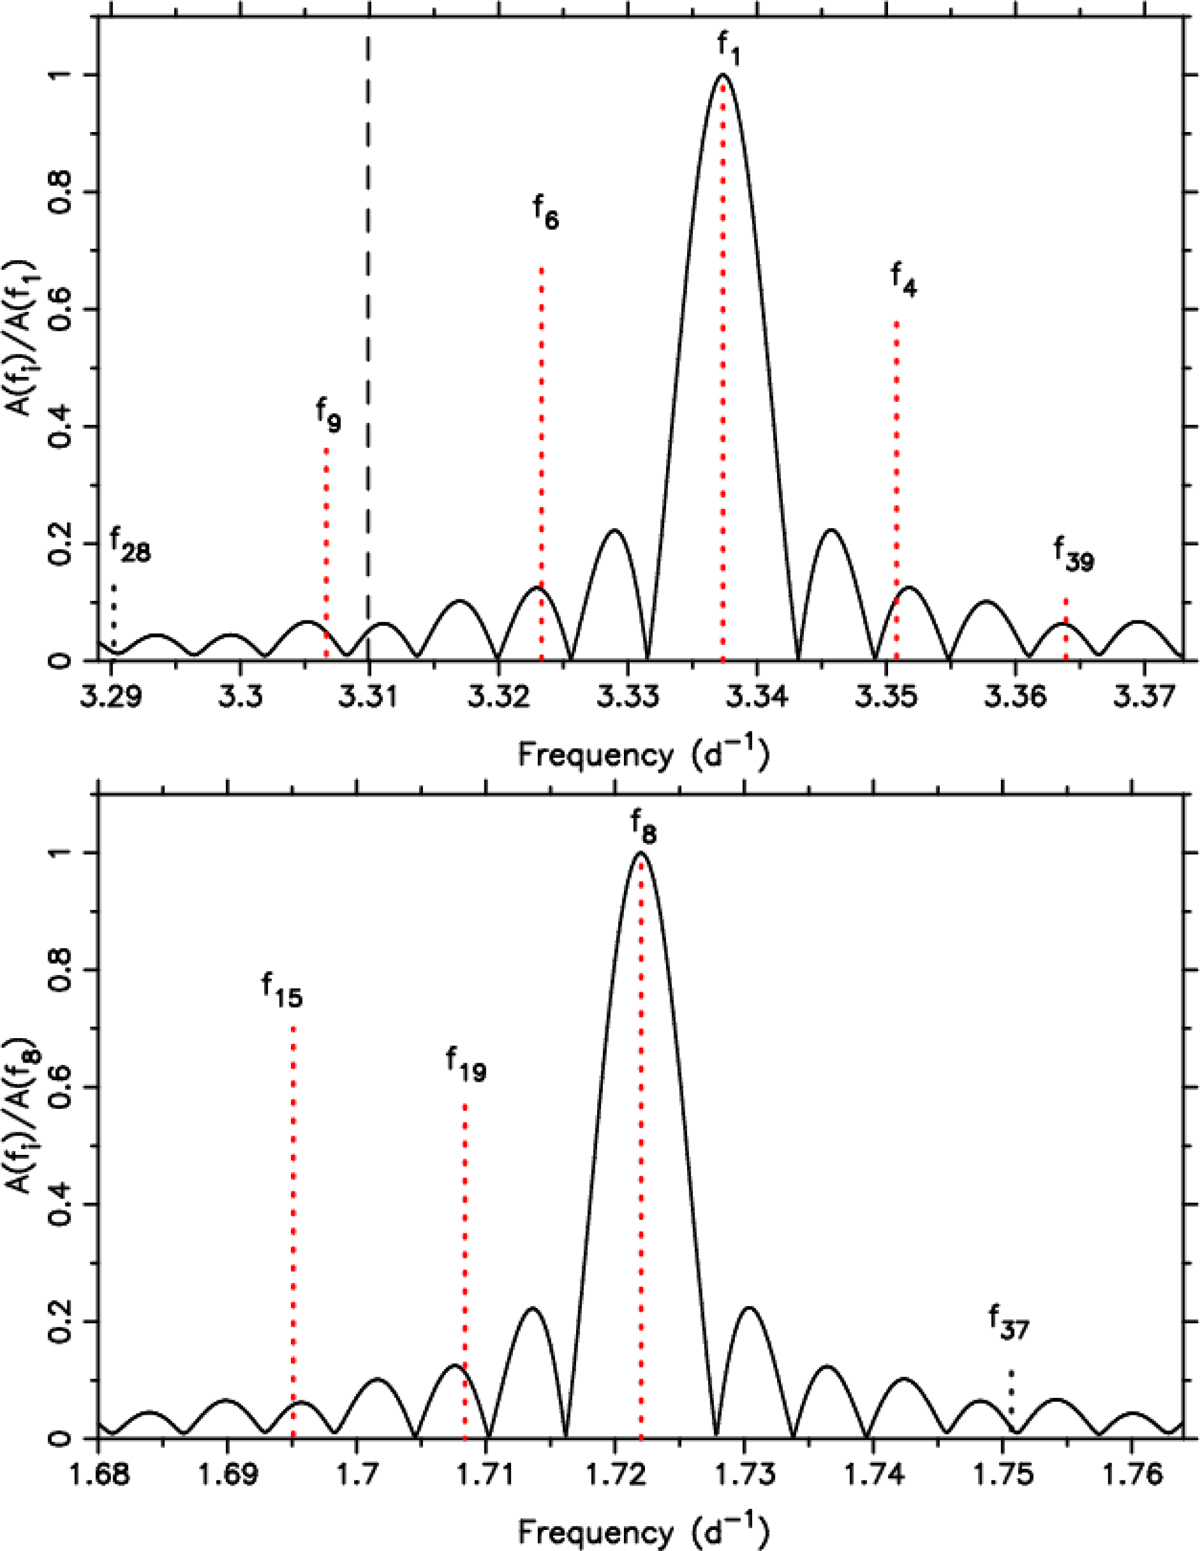
Two zoomed parts of the amplitude spectrum, where the length of the x-axis equals ten times the Rayleigh limit. The spectral window (full line) is placed at the local dominant frequency (cf. Table 1). Dotted lines indicate the extracted frequencies whose amplitude was normalised to the dominant one in that frequency regime (top panel: f1, bottom panel: f8). Black dotted lines indicate combination frequencies. The dashed line in the upper panel is placed at the position where the fifth quintuplet component would occur in the case of equal splitting.
Current usage metrics show cumulative count of Article Views (full-text article views including HTML views, PDF and ePub downloads, according to the available data) and Abstracts Views on Vision4Press platform.
Data correspond to usage on the plateform after 2015. The current usage metrics is available 48-96 hours after online publication and is updated daily on week days.
Initial download of the metrics may take a while.