Fig. 2.
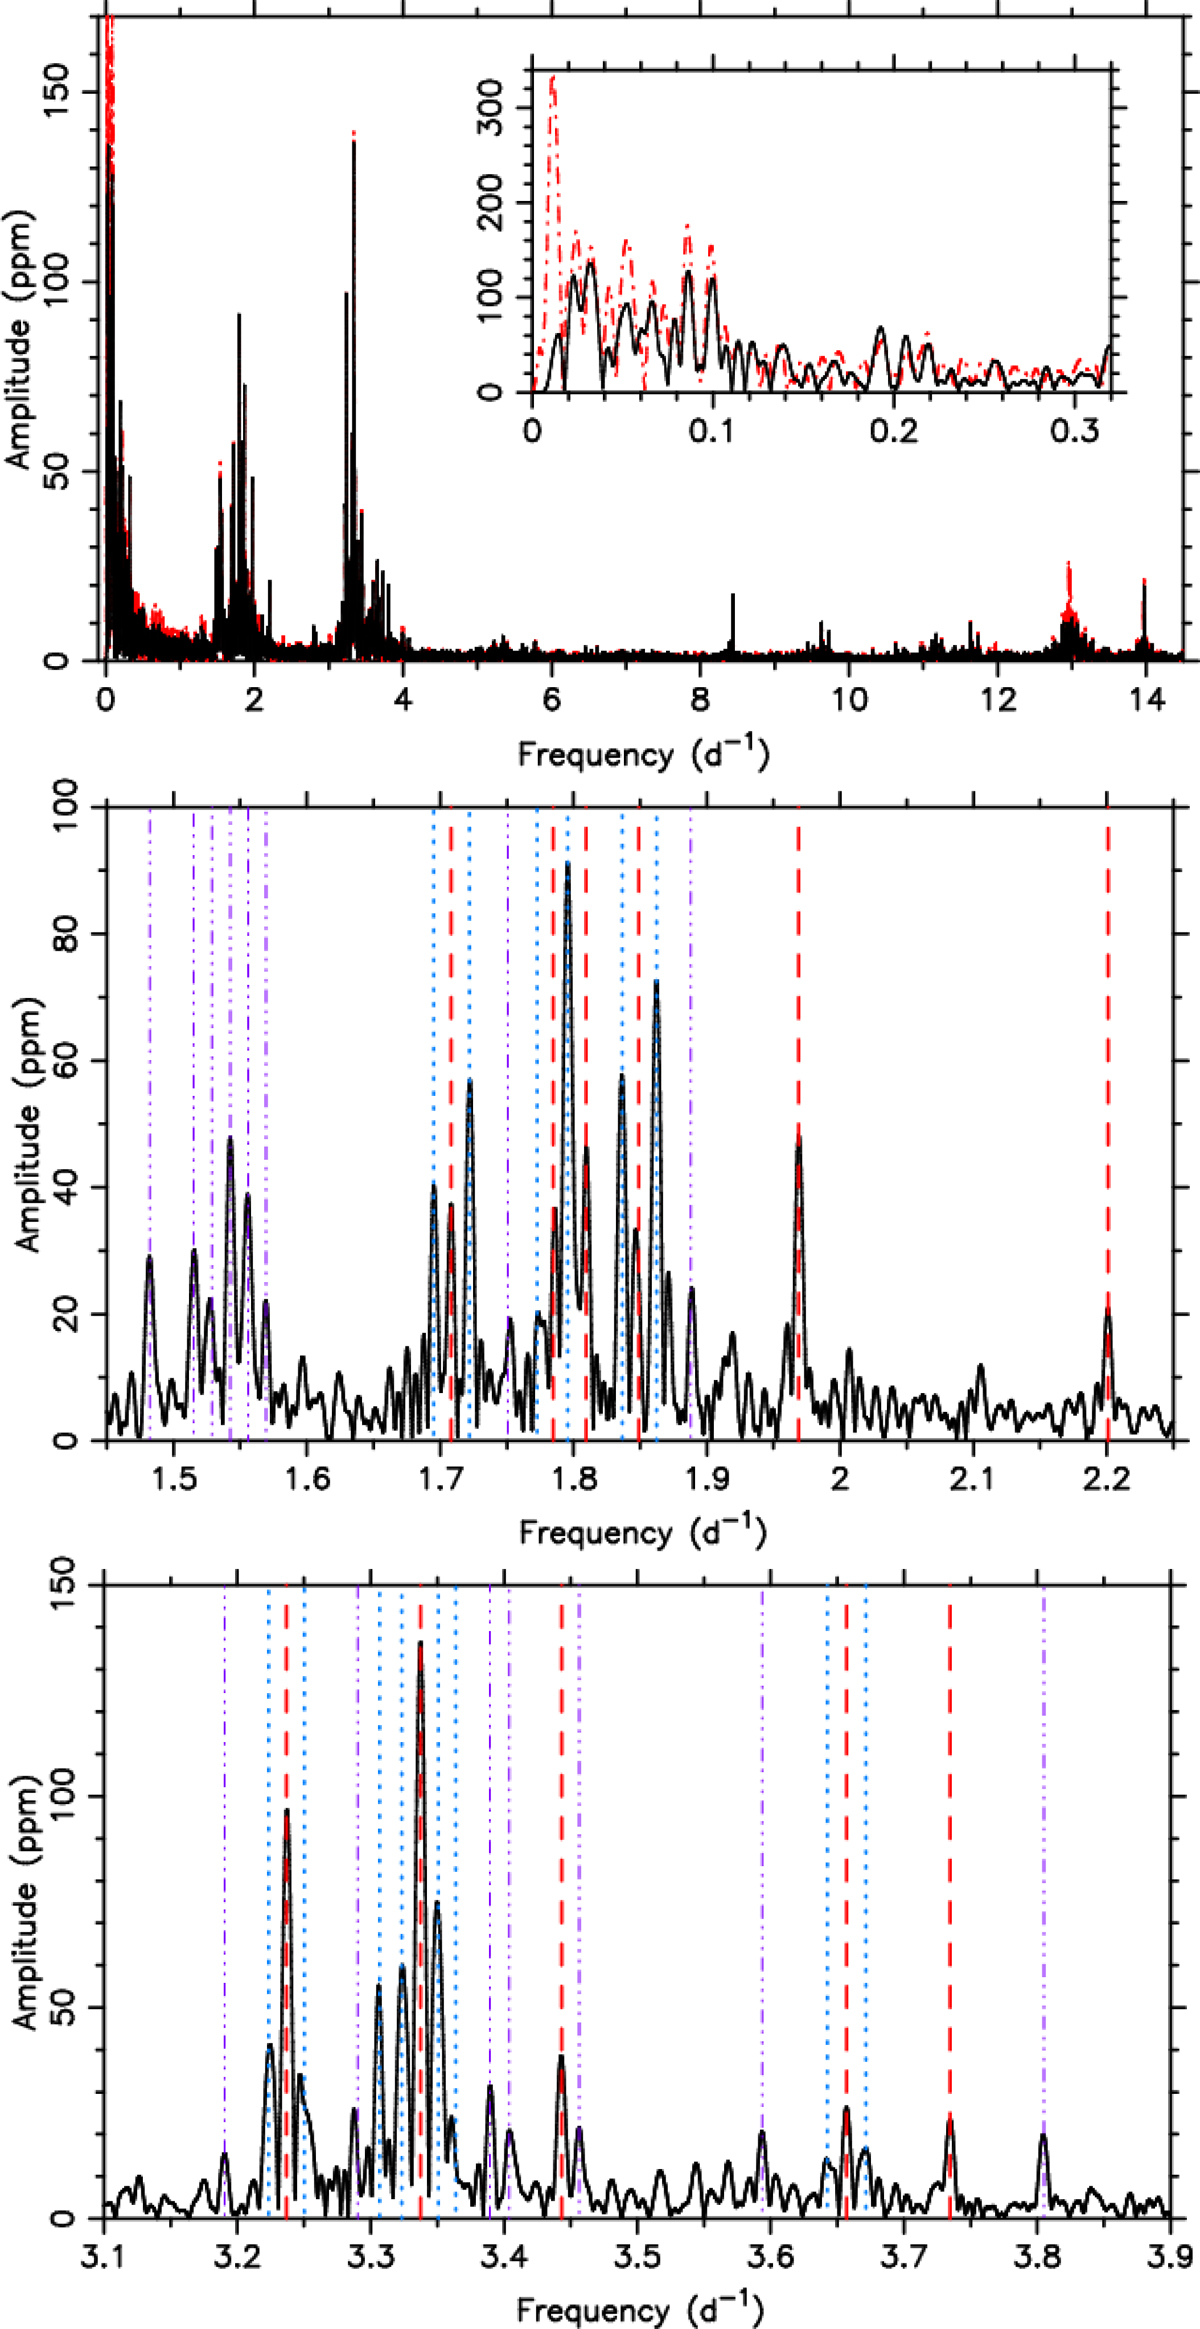
Upper panel: Lomb-Scargle periodograms of the CoRoT data shown in Fig. 1 with the same colour convention. Middle and lower panel: zoomed regions of interest, where the zonal mode frequencies used for the forward modelling are indicated by (red) dashed lines, the other multiplet components by (blue) dotted lines, and combination frequencies by (purple) dashed-dot-dot-dot lines.
Current usage metrics show cumulative count of Article Views (full-text article views including HTML views, PDF and ePub downloads, according to the available data) and Abstracts Views on Vision4Press platform.
Data correspond to usage on the plateform after 2015. The current usage metrics is available 48-96 hours after online publication and is updated daily on week days.
Initial download of the metrics may take a while.