Fig. 5
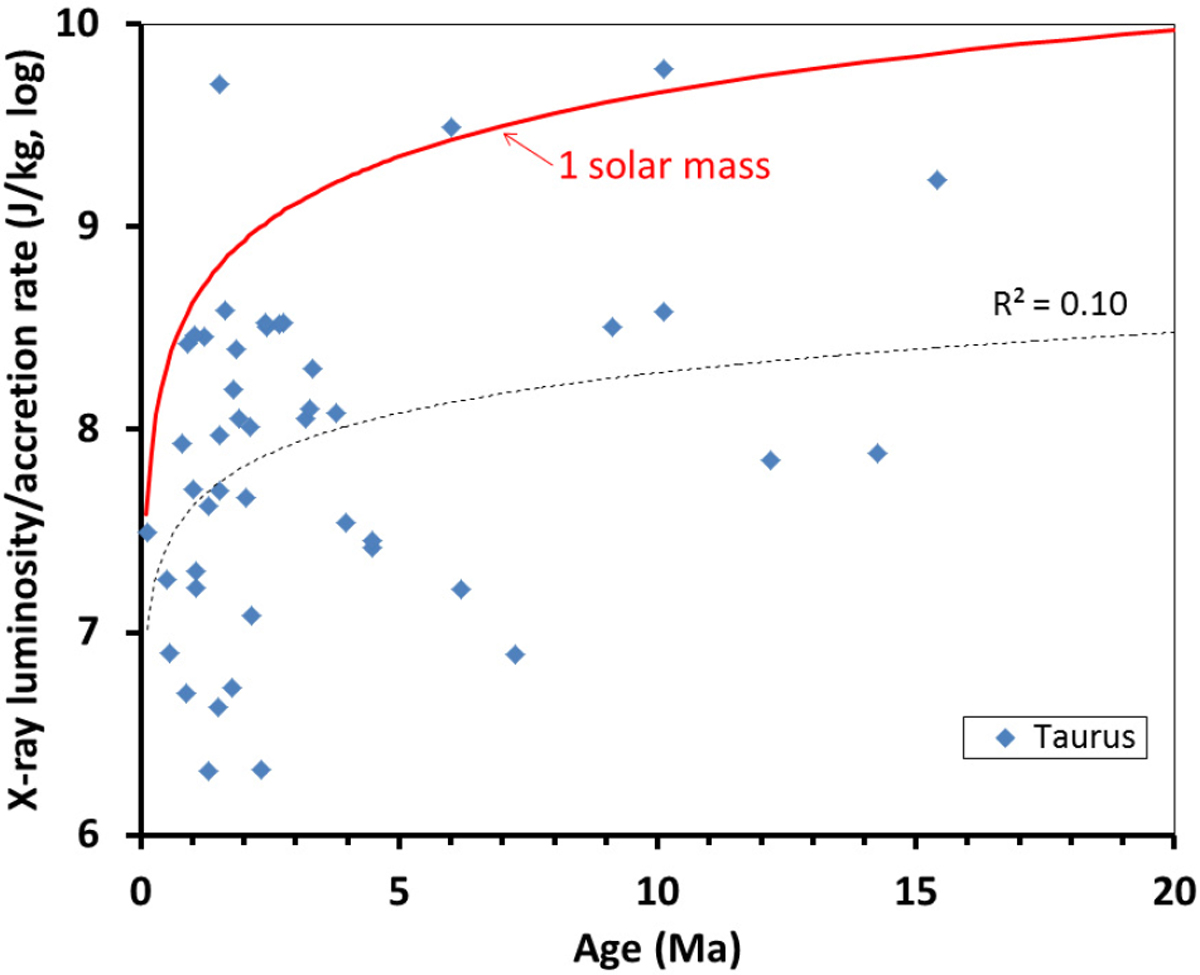
LX∕Ṁ for Taurusas a function of age (data from Güdel et al. 2007). Although a least-square fit (dashed line) shows a systematic increase with age, scatter is evident, in part owing to the diversity of stellar masses. Overplotted is the curve (red, continuous) corresponding to one solar mass (Telleschi et al. 2007; see beginning of Sect. 4.2). For reference, the normalizations used in Eq. (22) amount to LX ∕Ṁ = 107.7 J kg−1.
Current usage metrics show cumulative count of Article Views (full-text article views including HTML views, PDF and ePub downloads, according to the available data) and Abstracts Views on Vision4Press platform.
Data correspond to usage on the plateform after 2015. The current usage metrics is available 48-96 hours after online publication and is updated daily on week days.
Initial download of the metrics may take a while.