Fig. 9
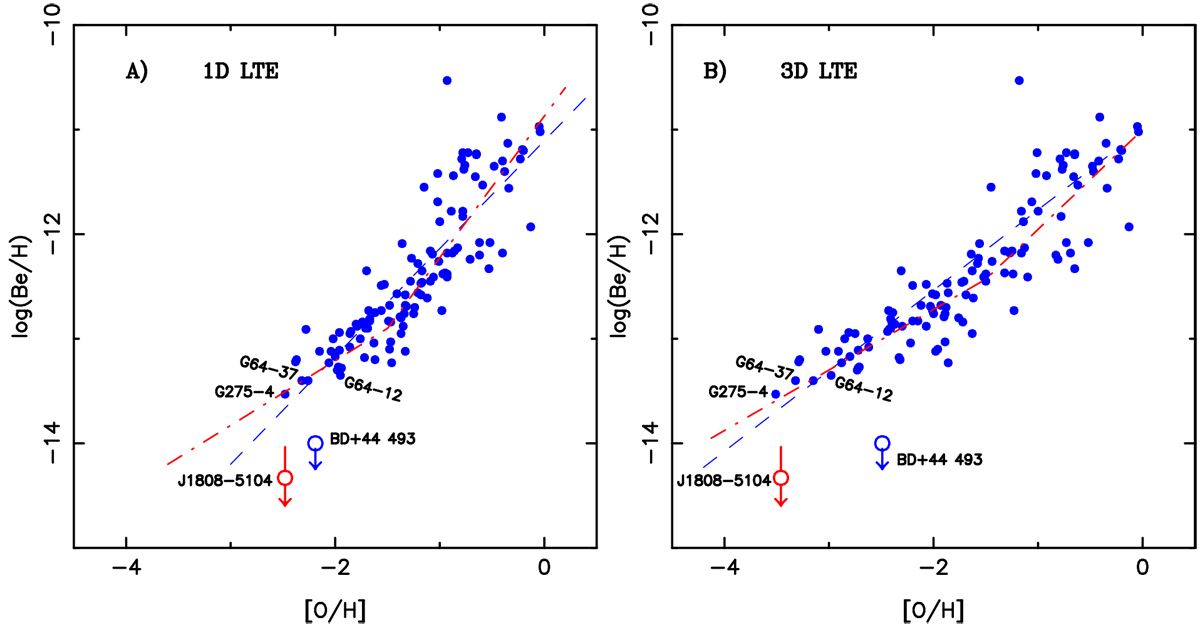
For galactic stars, log(Be/H) vs. [O/H] following Boesgaard et al. (2011; blue filled circles). The upper limit of the abundance of Be in 2MASS J1808-5104 and BD + 44°493 are indicated with big red and blue open circles. Panel A: the oxygen abundance was simply computed with the 1D LTE hypothesis, as in Boesgaard et al. (2011). Panel B: this abundance has been corrected for 3D effects. The blue dashed line represents the mean relation and the red dashed line the two-slope solution with a change of the slope around [O/H] = − 1.5 dex as in Boesgaard et al. (2011). The positions of BD + 44°493 and 2MASS J1808-5104 in this diagram are hardly compatible with the mean relations.
Current usage metrics show cumulative count of Article Views (full-text article views including HTML views, PDF and ePub downloads, according to the available data) and Abstracts Views on Vision4Press platform.
Data correspond to usage on the plateform after 2015. The current usage metrics is available 48-96 hours after online publication and is updated daily on week days.
Initial download of the metrics may take a while.