Fig. 7
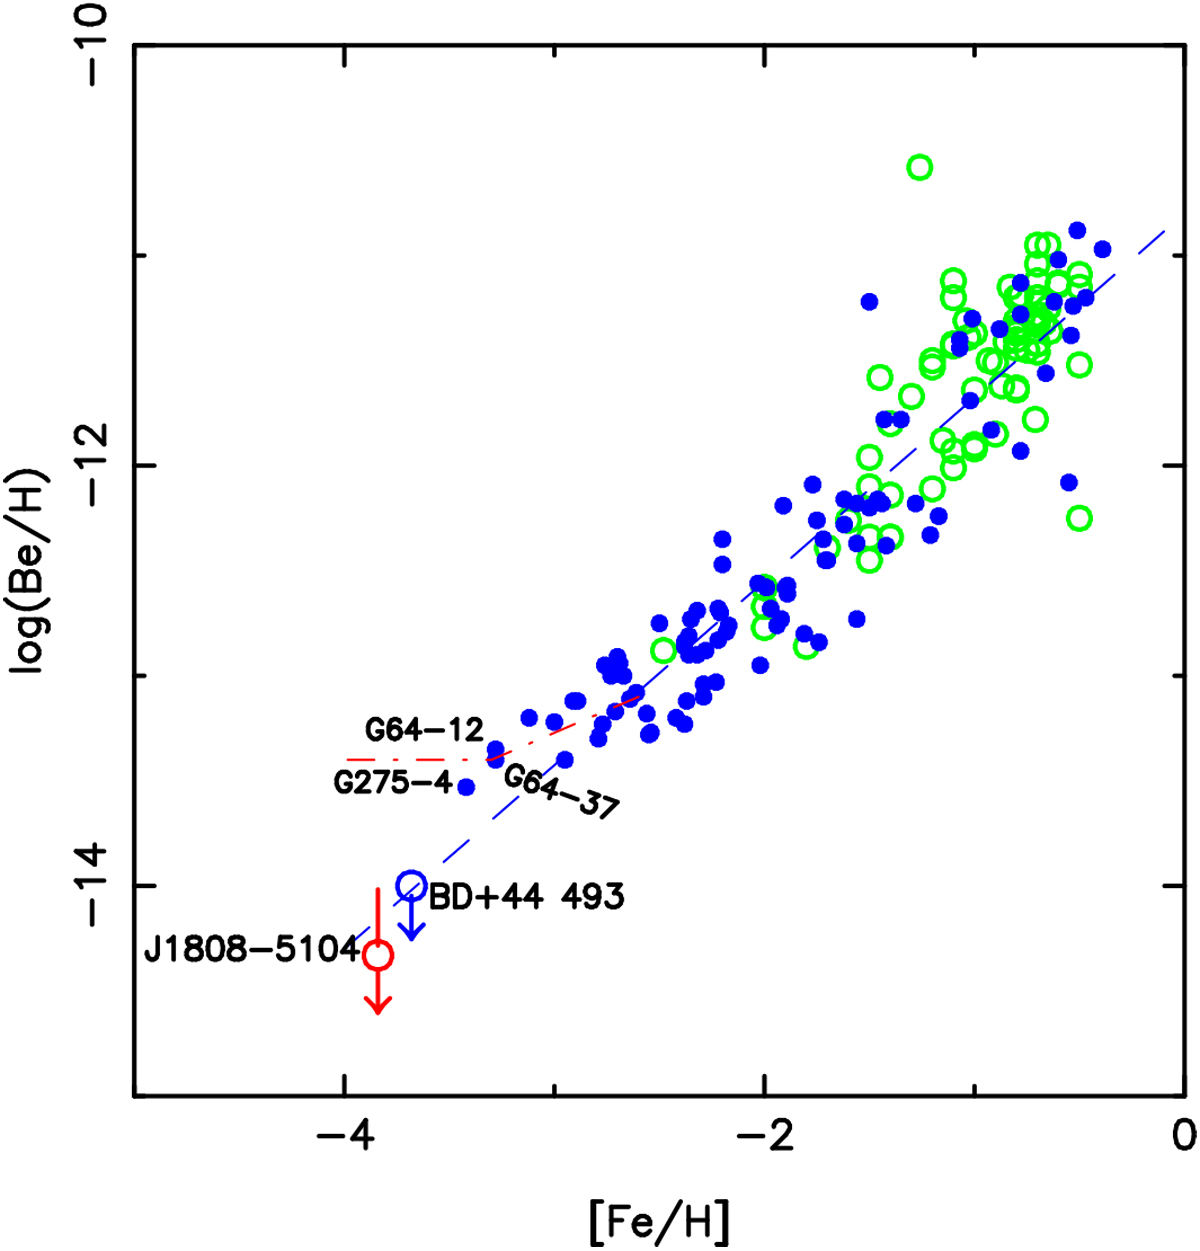
For galactic stars, log(Be/H) vs. [Fe/H]. The green open circles are from Smiljanic et al. (2009) and the blue filled circles from Boesgaard et al. (2011). However the position of G 64-12 in this diagram takes into account our new measurement of the Be abundance in this star adopting the model of Primas et al. (2000b), which is in better agreement with the Gaia-DR2 data. The upper limit of the abundance of Be in 2MASS J1808-5104 and BD + 44°493 are indicated with big red and blue open circles. The blue dashed straight line represents the mean relation. The curved red dash-dotted line at low metallicity represents the possibility of a plateau, suggested in particular, by the previous high Be abundance found in G 64-12 by Primas et al. (2000b) and Boesgaard et al. (2011). The very low Be abundance in the two additional stars BD + 44°493 and 2MASS J1808-5104 rules out the possibility of a plateau.
Current usage metrics show cumulative count of Article Views (full-text article views including HTML views, PDF and ePub downloads, according to the available data) and Abstracts Views on Vision4Press platform.
Data correspond to usage on the plateform after 2015. The current usage metrics is available 48-96 hours after online publication and is updated daily on week days.
Initial download of the metrics may take a while.