Free Access
Fig. 9
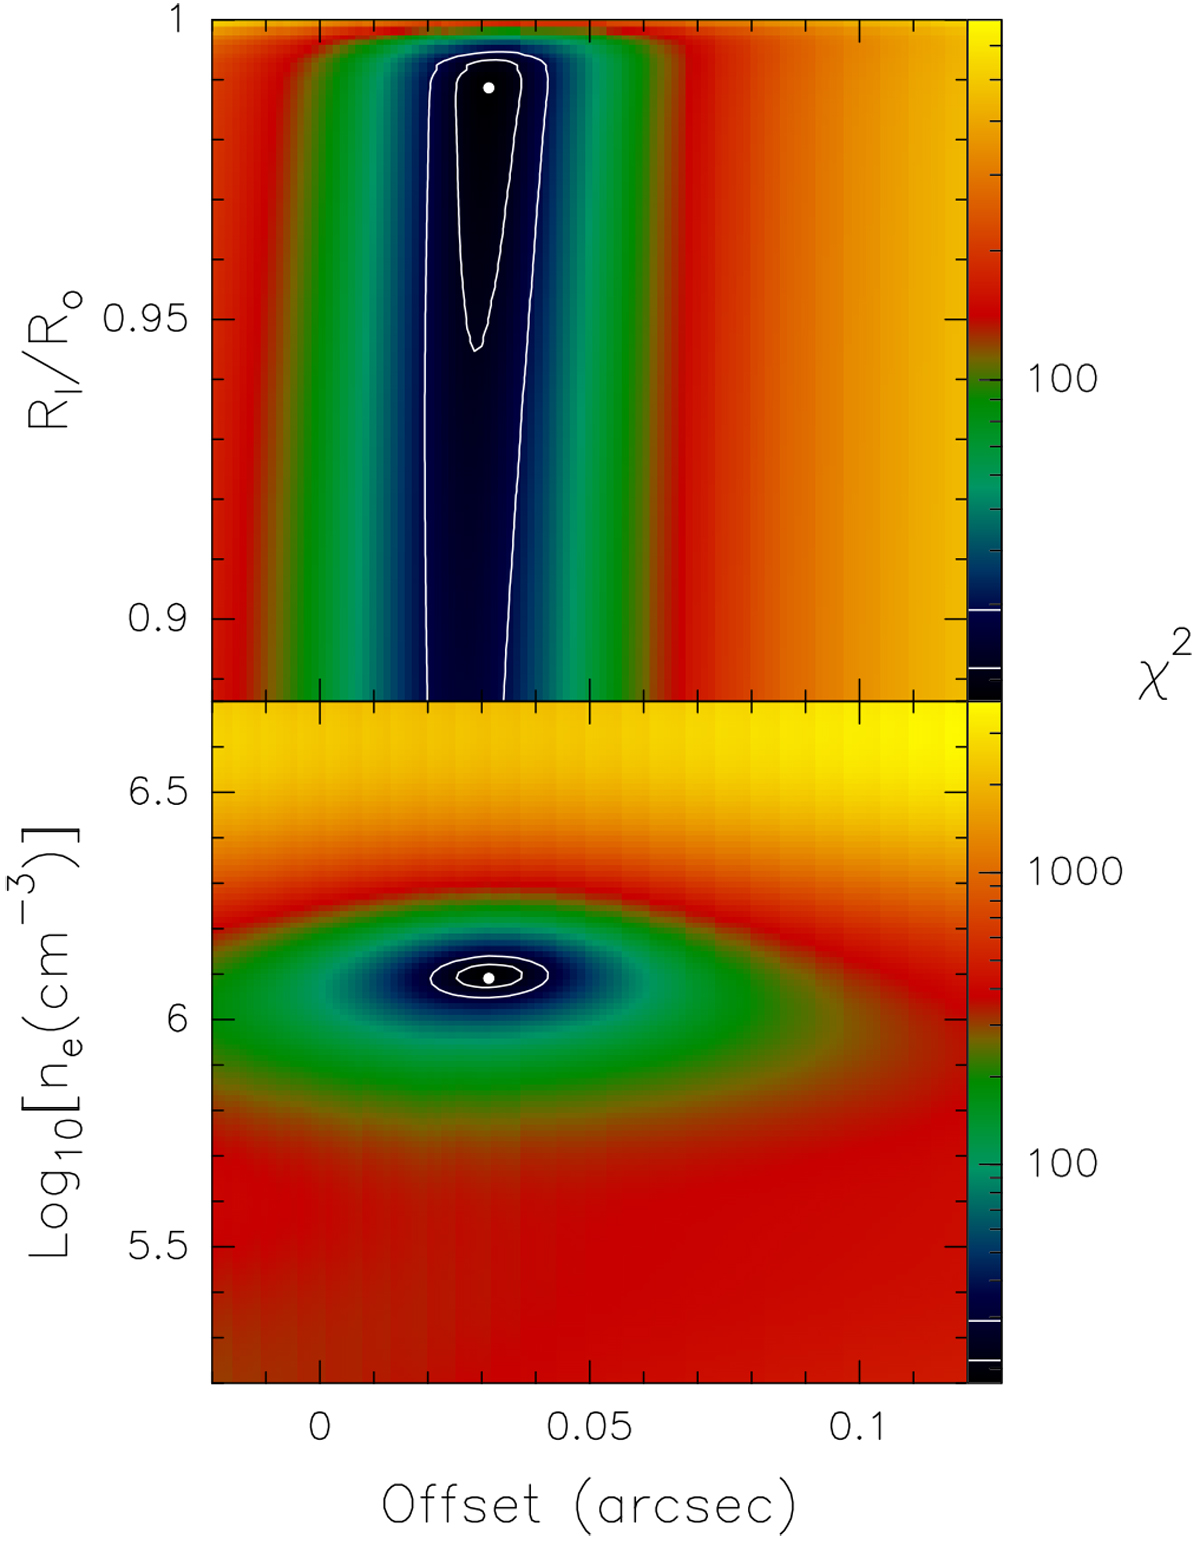
Plot of χ2 for the difference between the data profiles in Fig. 8 and the profiles computed with the model described in the text. The free variables are the offset identifying the position of the star, the ratio Rl ∕Ro, and the electron density. The white dots and contour levels have the same meaning as in Fig. 5.
Current usage metrics show cumulative count of Article Views (full-text article views including HTML views, PDF and ePub downloads, according to the available data) and Abstracts Views on Vision4Press platform.
Data correspond to usage on the plateform after 2015. The current usage metrics is available 48-96 hours after online publication and is updated daily on week days.
Initial download of the metrics may take a while.