Fig. 7
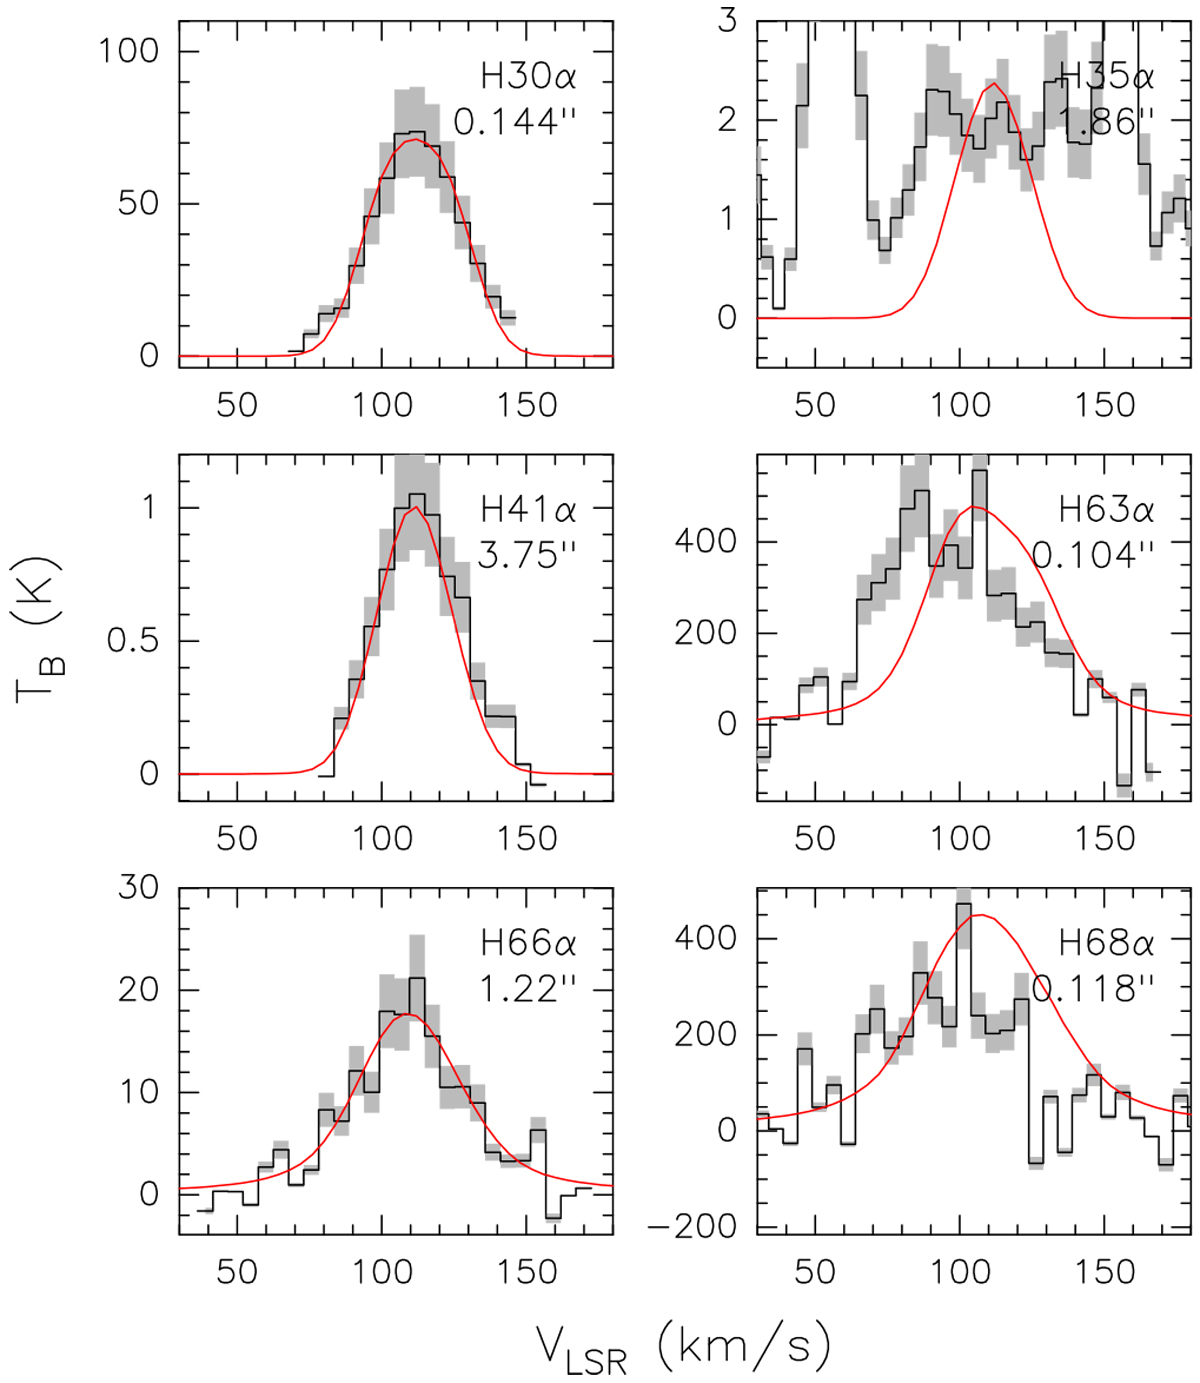
Spectra of the RRLs observed towards G24 A1 (histograms) compared to the best-fit model (red curves). Only the three lines to the left have been used to constrain the fit; those to the right are shown for the sake of comparison with the model predictions. The shaded area indicates the calibration uncertainty (20%). The line name and the corresponding angular resolution are given in the top right corner of each box.
Current usage metrics show cumulative count of Article Views (full-text article views including HTML views, PDF and ePub downloads, according to the available data) and Abstracts Views on Vision4Press platform.
Data correspond to usage on the plateform after 2015. The current usage metrics is available 48-96 hours after online publication and is updated daily on week days.
Initial download of the metrics may take a while.