Free Access
Fig. 5
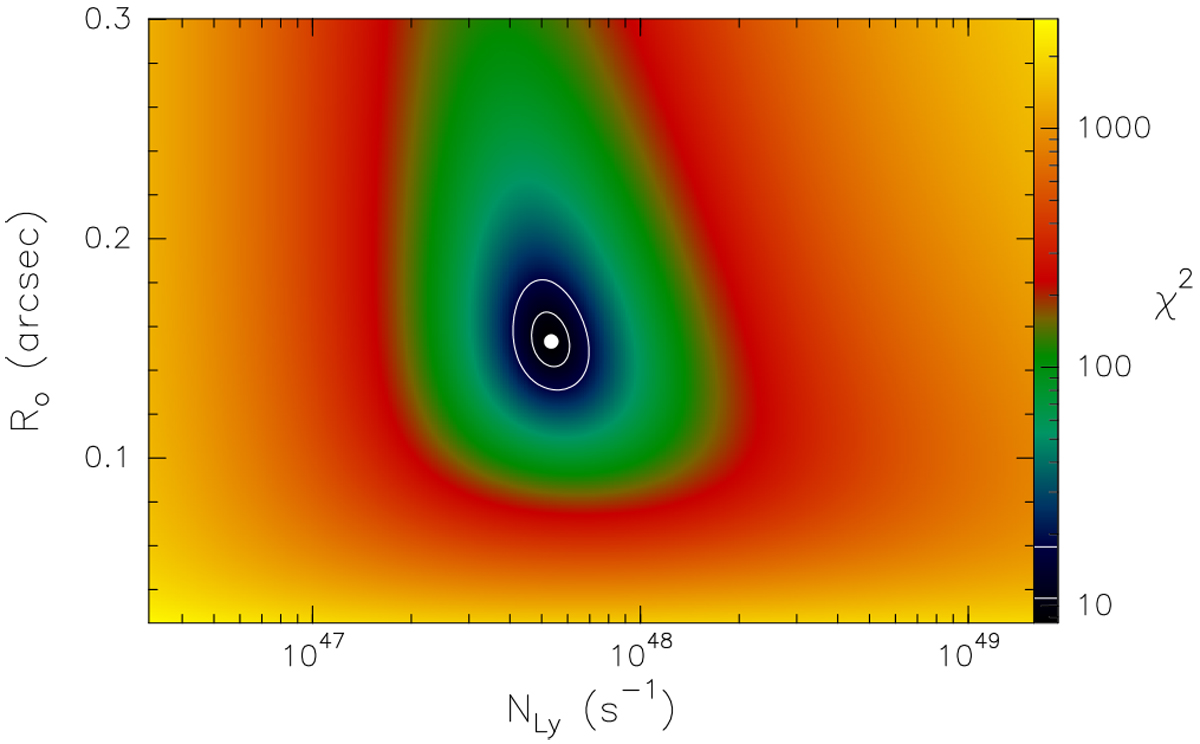
Plot of χ2 obtained by fitting Eq. (1) to the data in Table 2. The minimum is marked by the white dot, while the contours correspond to 68% (1σ) and 99% reliability (see Table 1 in Lampton et al. 1976) and the corresponding levels are indicated in the colour scale to the right.
Current usage metrics show cumulative count of Article Views (full-text article views including HTML views, PDF and ePub downloads, according to the available data) and Abstracts Views on Vision4Press platform.
Data correspond to usage on the plateform after 2015. The current usage metrics is available 48-96 hours after online publication and is updated daily on week days.
Initial download of the metrics may take a while.