Fig. 4
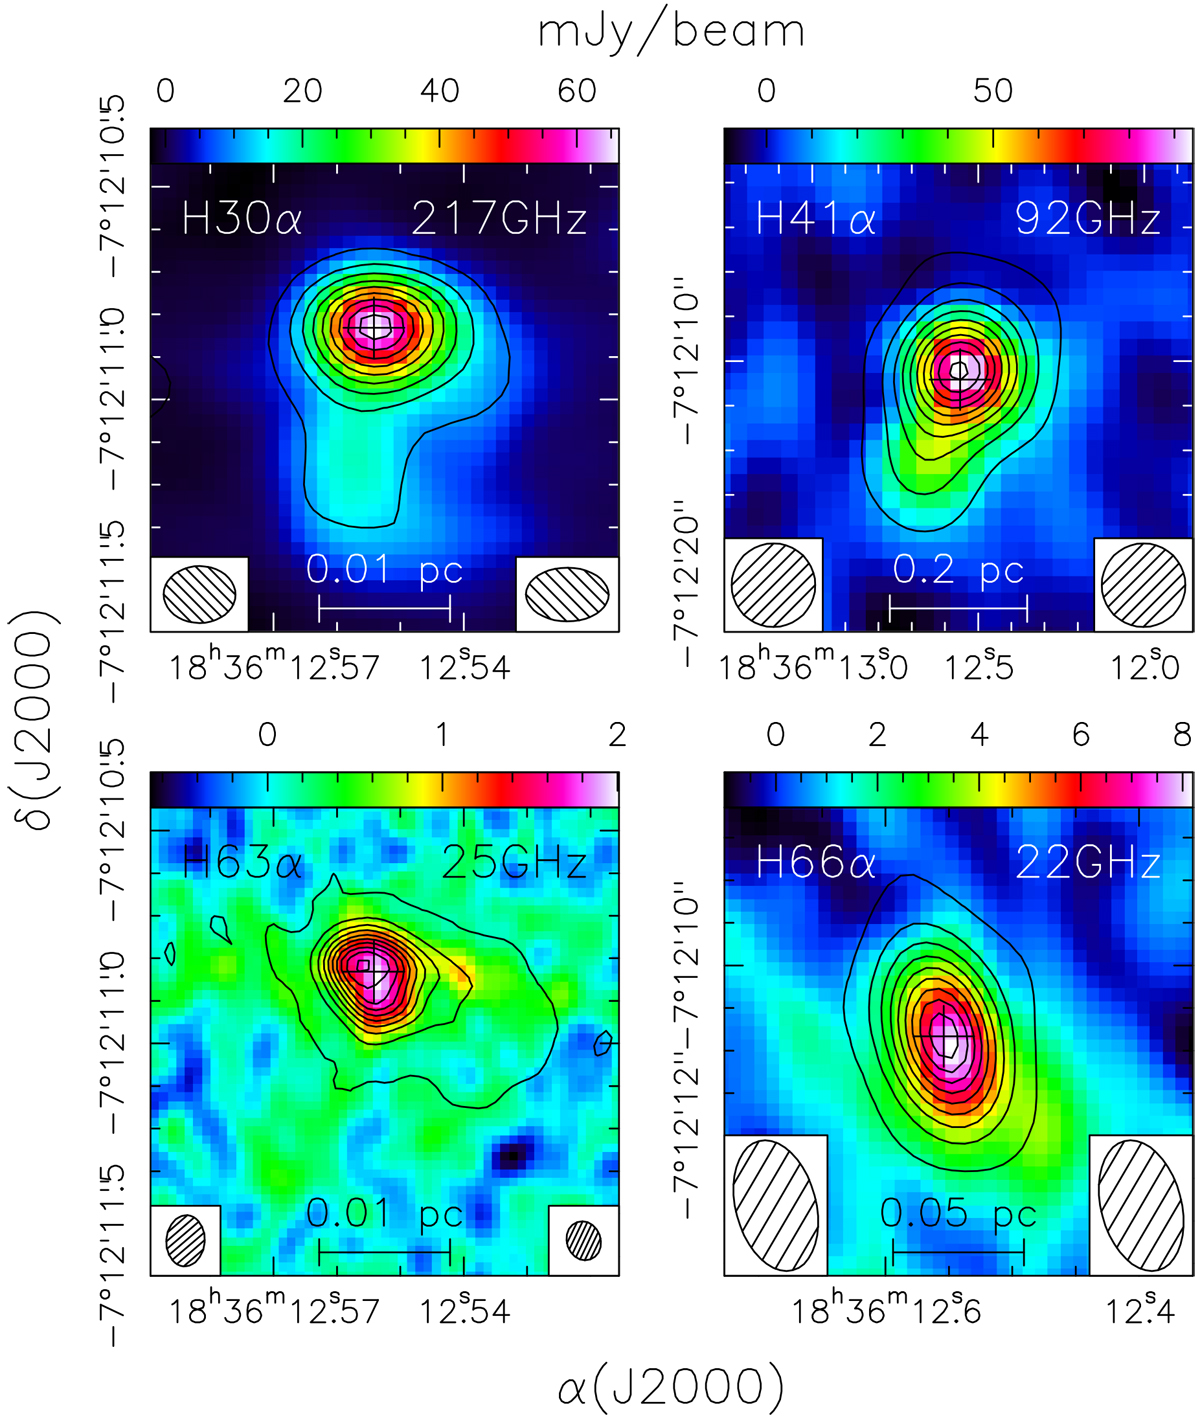
Images of the integrated emission of the four recombination lines observed by us (colour scales) with overlaid contour maps of the continuum emission at the same frequencies. The cross indicates the peak of the H30α emission and helps comparison among the different panels. The synthesised beams of the RRL images are shown in the bottom left corners, those of the continuum maps in the bottom right corners. Contour levels range from 2.5 to 34.5 in steps of 3.4 mJy beam−1 at 217 GHz, from 10 to 154 in steps of 16 mJy beam−1 at 92 GHz, from 0.06 to 16.26 in steps of 1.8 mJy beam−1 at 25 GHz, and from 4.6 to 78.2 in steps of 9.2 mJy beam−1 at 22 GHz. In all cases, the minimum contour level corresponds to 5σ.
Current usage metrics show cumulative count of Article Views (full-text article views including HTML views, PDF and ePub downloads, according to the available data) and Abstracts Views on Vision4Press platform.
Data correspond to usage on the plateform after 2015. The current usage metrics is available 48-96 hours after online publication and is updated daily on week days.
Initial download of the metrics may take a while.